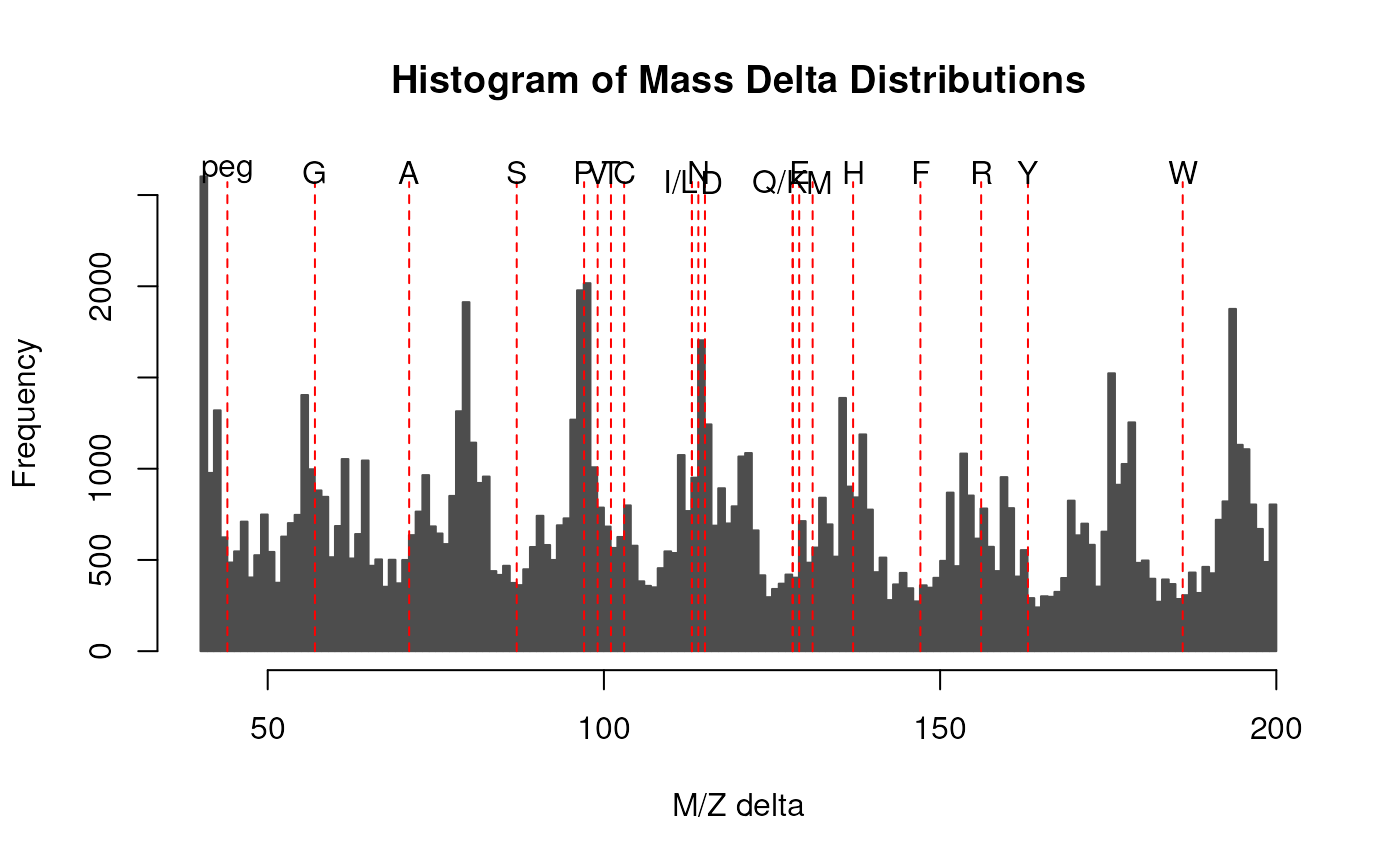
The M/Z delta plot illustrates the suitability of MS2 spectra for identification by plotting the M/Z differences of the most intense peaks. The resulting histogram should optimally show modes at amino acid residu masses. The plots have been described in Foster et al. 2011.
Only a certain percentage of most intense MS2 peaks are taken into
account to use the most significant signal. Default value is 20%
(see percentage argument). The difference between peaks is then
computed for all individual spectra and their distribution is
plotted as a histogram. Delta M/Z between 40 and 200 are plotted
by default, to encompass the residue masses of all amino acids and
several common contaminants, although this can be changes with the
mzRange argument.
In addition to the processing described above, isobaric reporter tag peaks and the precursor peak can also be removed from the MS2 spectrum, to avoid interence with the fragment peaks.
Note that figures in Foster et al. 2011 have been produced and optimised for centroided data. While running the function on profile mode is likely fine, it is recommended to use centroided data.
A ggplot2 based function called ggMzDeltaPlot() to visualise
the M/Z delta distributions is available at
https://gist.github.com/lgatto/c72b1ff5a4116118dbb34d9d2bc3470a.
Arguments
- object
An instance of class
Spectra().- percentage
numeric(1)between 0 and 1 indicating the percentage of the most intense peaks in each MS2 spectrum to include in the calculation. Default is 0.2.- mzRange
numeric(2)with the upper and lower M/Z to be used to the MZ deltas. Default isc(40, 200).- BPPARAM
An optional
BiocParallelParaminstance determining the parallel back-end to be used during evaluation. Default is to useBiocParallel::bpparam(). See?BiocParallel::bpparamfor details.- x
A list of M/Z delta values, as returned by
computeMzDeltas().- aaLabels
logical(1)defining whether the amino acids should be labelled on the histogram. Default isTRUE.
Value
computeMzDeltas() returns a list of numeric
vectors. plotMzDelta() is used to visualise of M/Z delta
distributions.
References
Foster JM, Degroeve S, Gatto L, Visser M, Wang R, Griss J, et al. A posteriori quality control for the curation and reuse of public proteomics data. Proteomics. 2011;11: 2182-2194. http://dx.doi.org/10.1002/pmic.201000602
Examples
f <- MsDataHub::TMT_Erwinia_1uLSike_Top10HCD_isol2_45stepped_60min_01.20141210.mzML.gz()
#> see ?MsDataHub and browseVignettes('MsDataHub') for documentation
#> loading from cache
sp <- Spectra(f)

d <- computeMzDeltas(sp[1:1000])
plotMzDelta(d)