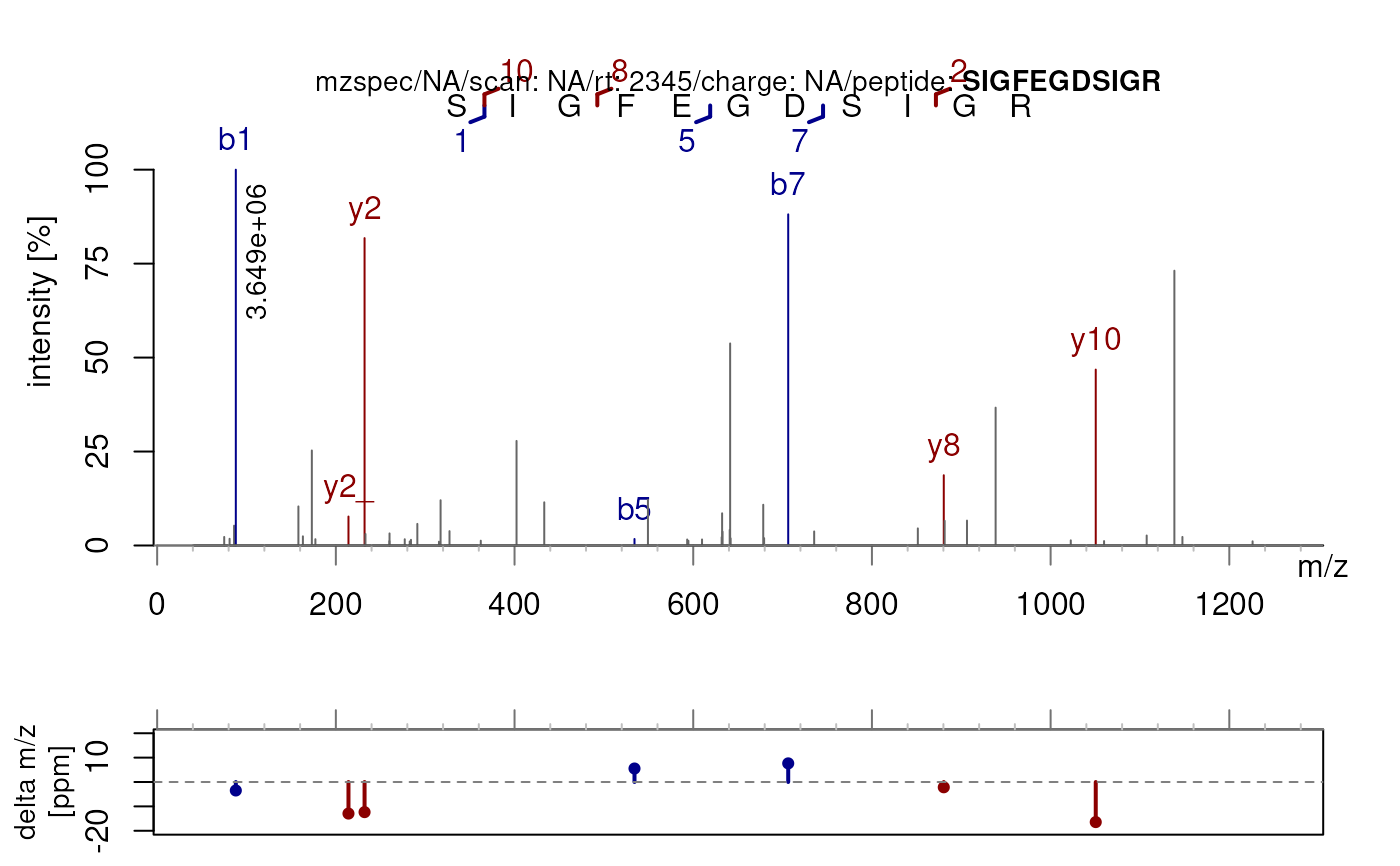
plotSpectraPTM() creates annotated visualisations of MS/MS spectra,
designed to explore fragment identifications and post-translational
modifications (PTMs).
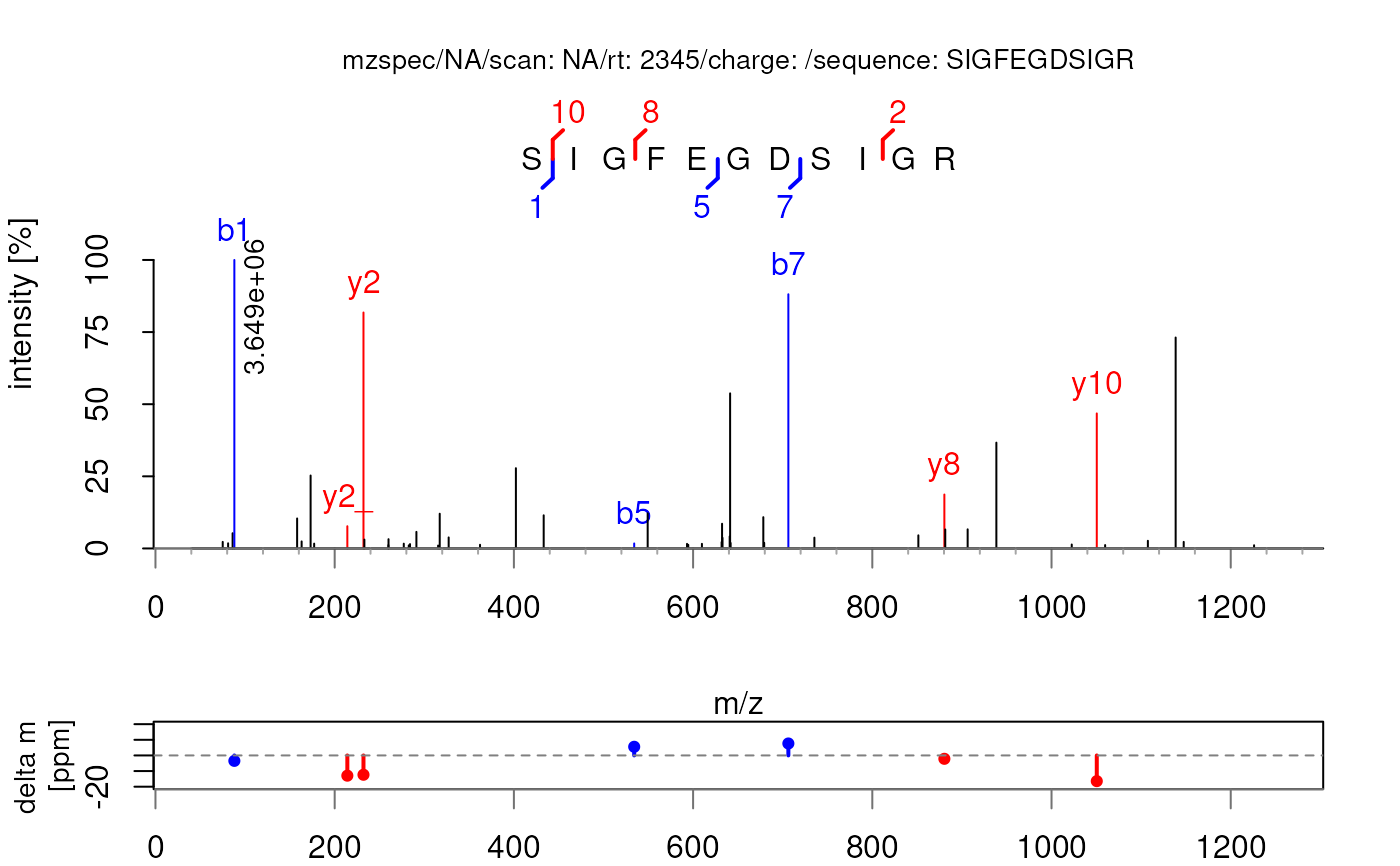
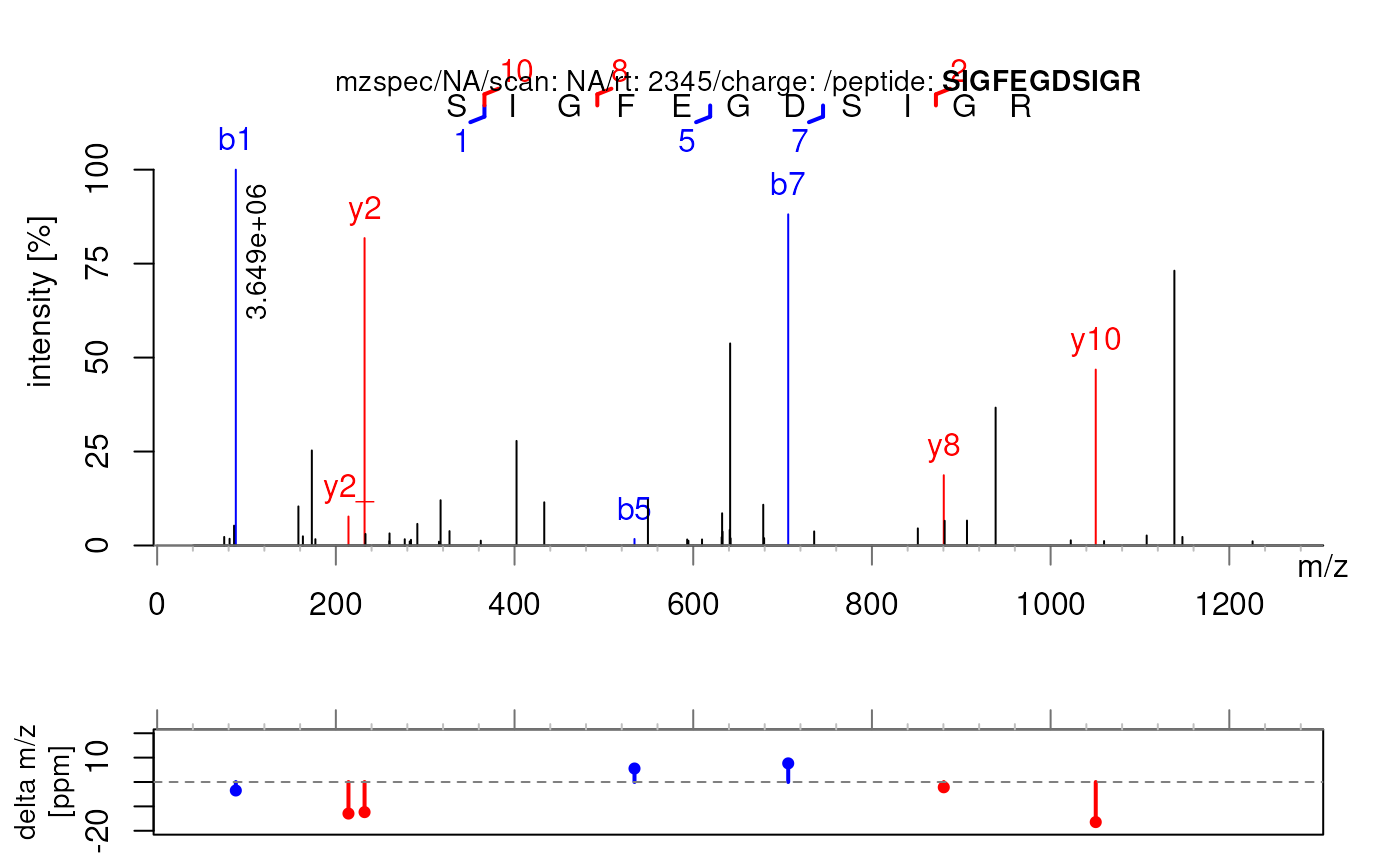
plotSpectraPTM() plots a spectrum's m/z values on the x-axis and
corresponding intensities on the y-axis, labeling the peaks according to
theoretical fragment ions (e.g., b, y, a, c, x, z) computed using
labelFragments() and calculateFragments().
plotSpectraPTM(
  x,
  deltaMz = TRUE,
  ppm = 20,
  xlab = "m/z",
  ylab = "intensity [%]",
  xlim = numeric(),
  ylim = numeric(),
  main = character(),
  col = c(y = "darkred", b = "darkblue", acxy = "darkgreen", other = "grey40"),
  labelCex = 1,
  labelSrt = 0,
  labelAdj = NULL,
  labelPos = 3,
  labelOffset = 0.5,
  asp = 1,
  minorTicks = TRUE,
  USI = TRUE,
  fixedModifications = NULL,
  variableModifications = NULL,
  addCarbamidomethyl = TRUE,
  z = NULL,
  allCharges = TRUE,
  ...
)
Arguments
- x
a
Spectra()object.- deltaMz
logical(1L)IfTRUE, adds an additional plot showing the difference of mass over charge between matched oberved and theoretical fragments in parts per million. Does not yet support modifications. The matching is based oncalculateFragments()and needs a 'sequence' variable inspectraVariables(x). Default is set toTRUE.- ppm
integer(1L)Sets the limits of the delta m/z plot and is passed tolabelFragments().- xlab
character(1)with the label for the x-axis (by defaultxlab = "m/z").- ylab
character(1)with the label for the y-axis (by defaultylab = "intensity").- xlim
numeric(2)defining the x-axis limits. The range of m/z values are used by default.- ylim
numeric(2)defining the y-axis limits. The range of intensity values are used by default.- main
character(1)with the title for the plot. By default the spectrum's MS level and retention time (in seconds) is used.- col
Named
character(4L). Colors for the labels, the character names need to be "b", "y", "acxz" and "other", respectively for the b-ions, y-ions, a,c,x,z-ions and the unidentified fragments.- labelCex
numeric(1)giving the amount by which the text should be magnified relative to the default. See parametercexinpar().- labelSrt
numeric(1)defining the rotation of the label. See parametersrtintext().- labelAdj
see parameter
adjintext().- labelPos
see parameter
posintext().- labelOffset
see parameter
offsetintext().- asp
for
plotSpectraPTM(), the target ratio (columns / rows) when plotting mutliple spectra (e.g. for 20 spectra use asp = 4/5 for 4 columns and 5 rows or asp = 5/4 for 5 columns and 4 rows; seegrDevices::n2mfrow()for details). IfdeltaMzisTRUE,aspis ignored.- minorTicks
logical(1L). IfTRUE, minor ticks are added to the plots. Default is set toTRUE.- USI
logical(1L). IfTRUE, the universal spectrum identifier is displayed.- fixedModifications
Named
numericorcharacter, passed toPTMods::addFixedModifications(). Applied to all sequences before plotting.NULLby default (no fixed modifications applied).- variableModifications
Named
numericorcharacter, passed toPTMods::addVariableModifications(). Each unique combination of variable modifications generates a separate copy of the corresponding spectrum.NULLby default (no variable modifications applied).- addCarbamidomethyl
logical(1L) set to
TRUEby default. Applies carbamidomethylation as a fixed modification unless carbamidomethyl is already present in the given sequences. If carbamidomethylation should be applied as a variable modification, do setaddCarbamidomethylation = FALSE. For more details on this, see the appropriate vignette by running `vignette("Fragments", package = "PSMatch")- z
numeric()vector of length equal tolength(x)orNULL. Each element specifies the charge state (or maximum charge state ifallCharges = TRUE) for the corresponding spectrum. IfNULL(default), usesprecursorCharge(x)for each spectrum. Cannot be used simultaneously withvariableModifications.- allCharges
logical(1L). IfTRUE(default), generates fragments for all charge states from 1 up to the value specified (either fromzorprecursorCharge(x)). IfFALSE, generates fragments only for the specified charge state.- ...
additional parameters to be passed to the
labelFragments()andcalculateFragments()functions.
Value
Creates a plot depicting an MS/MS-MS spectrum.
See also
Examples
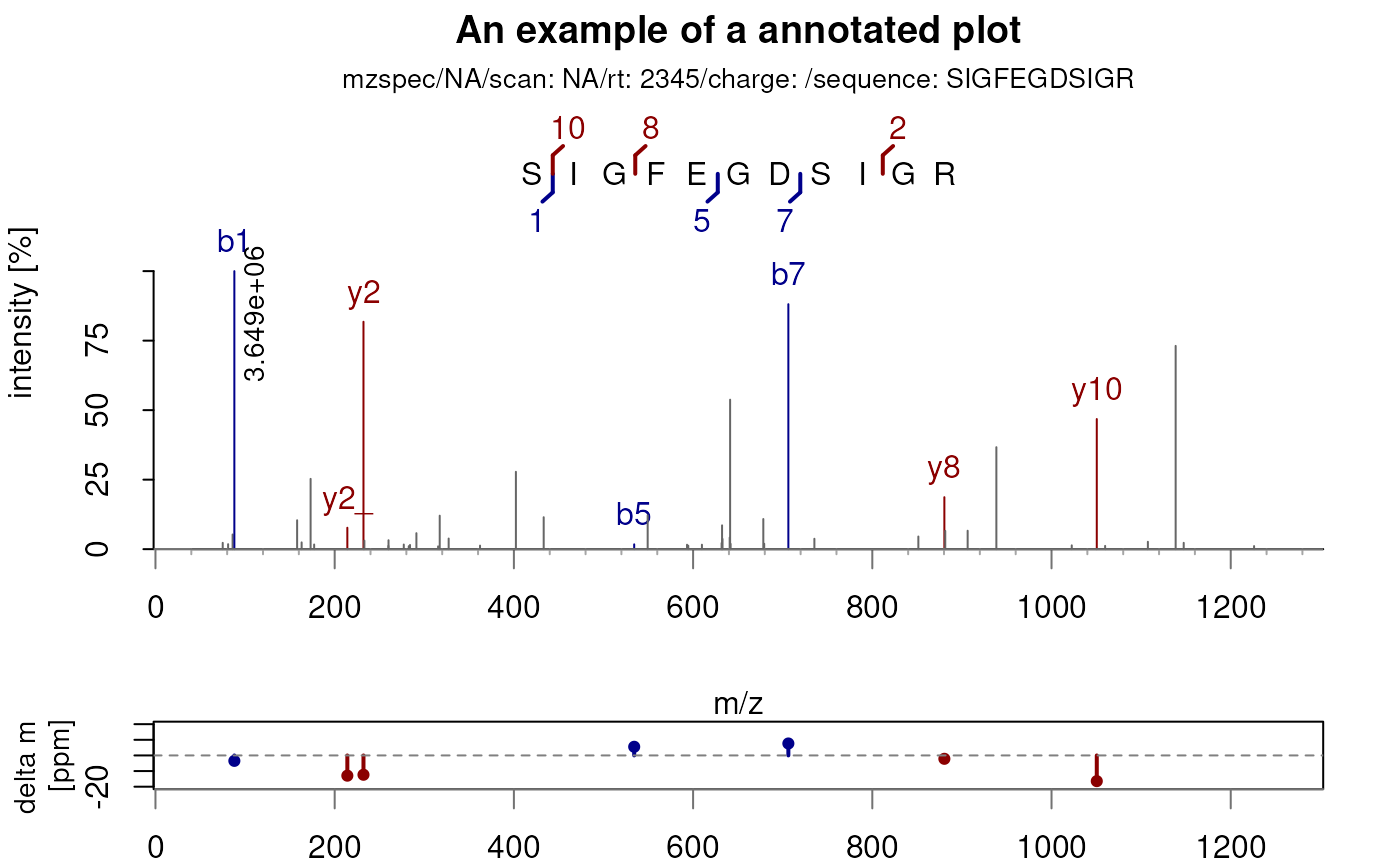
library("Spectra")
sp <- DataFrame(msLevel = 2L, rtime = 2345, sequence = "SIGFEGDSIGR")
sp$mz <- list(c(75.048614501953, 81.069030761719, 86.085876464844,
88.039, 158.089569091797, 163.114898681641,
173.128, 177.098587036133, 214.127075195312,
232.137542724609, 233.140335083008, 259.938415527344,
260.084167480469, 277.111572265625, 282.680786132812,
284.079437255859, 291.208282470703, 315.422576904297,
317.22509765625, 327.2060546875, 362.211944580078,
402.235290527344, 433.255004882812, 534.258783,
549.305236816406, 593.217041015625, 594.595092773438,
609.848327636719, 631.819702148438, 632.324035644531,
632.804931640625, 640.8193359375, 641.309936523438,
641.82568359375, 678.357238769531, 679.346252441406,
706.309623, 735.358947753906, 851.384033203125,
880.414001464844, 881.40185546875, 906.396433105469,
938.445861816406, 1022.56658935547, 1050.50415039062,
1059.82800292969, 1107.52734375, 1138.521484375,
1147.51538085938, 1226.056640625))
sp$intensity <- list(c(83143.03, 65473.8, 192735.53, 3649178.5,
379537.81, 89117.58, 922802.69, 61190.44,
281353.22, 2984798.75, 111935.03, 42512.57,
117443.59, 60773.67, 39108.15, 55350.43,
209952.97, 37001.18, 439515.53, 139584.47,
46842.71, 1015457.44, 419382.31, 63378.77,
444406.66, 58426.91, 46007.71, 58711.72,
80675.59, 312799.97, 134451.72, 151969.72,
1961975, 69405.76, 395735.62, 71002.98,
3215457.75, 136619.47, 166158.69, 682329.75,
239964.69, 242025.44, 1338597.62, 50118.02,
1708093.12, 43119.03, 97048.02, 2668231.75,
83310.2, 40705.72))
sp <- Spectra(sp)
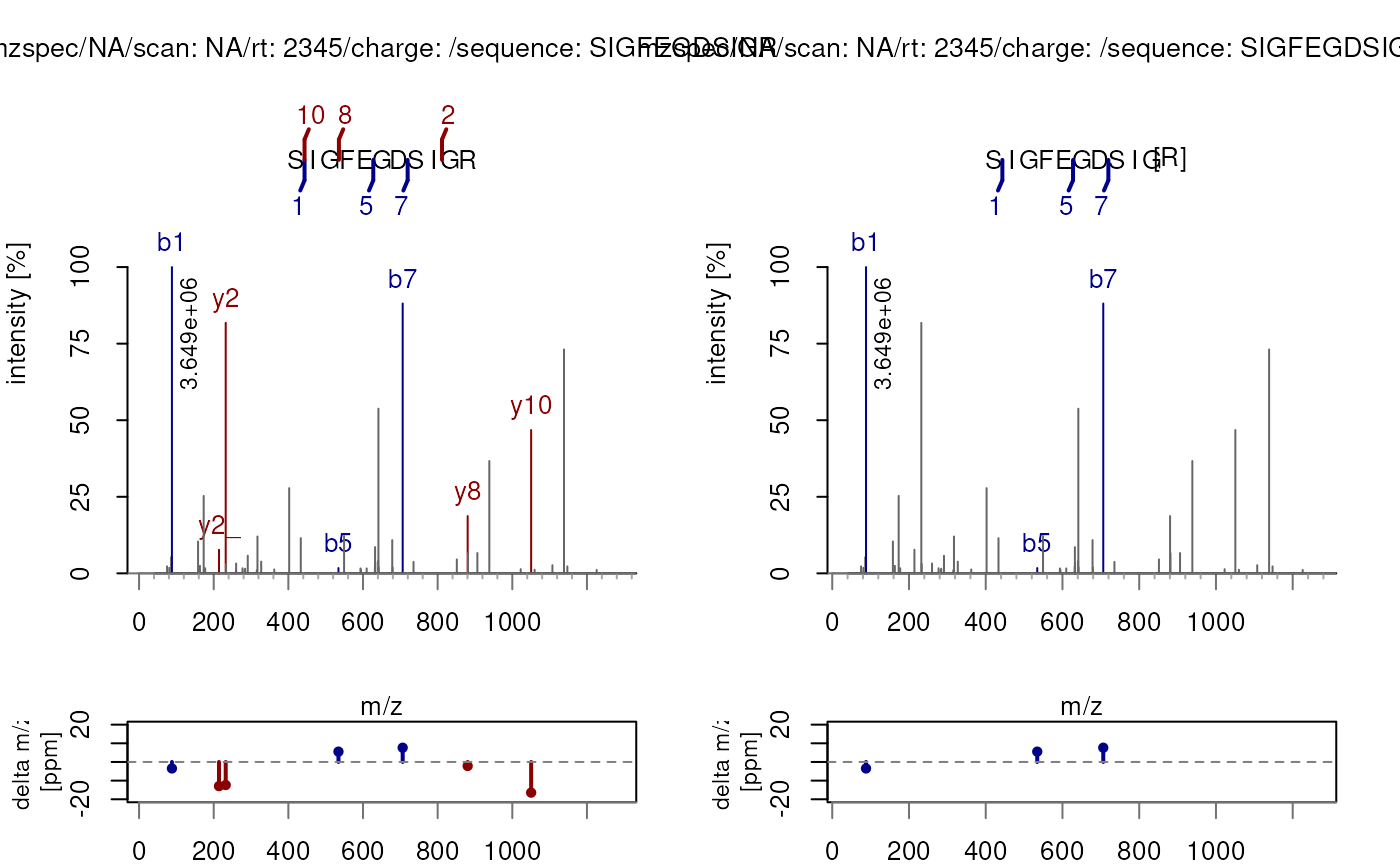
## Annotate the spectum with the fragment labels
plotSpectraPTM(sp, main = "An example of an annotated plot")
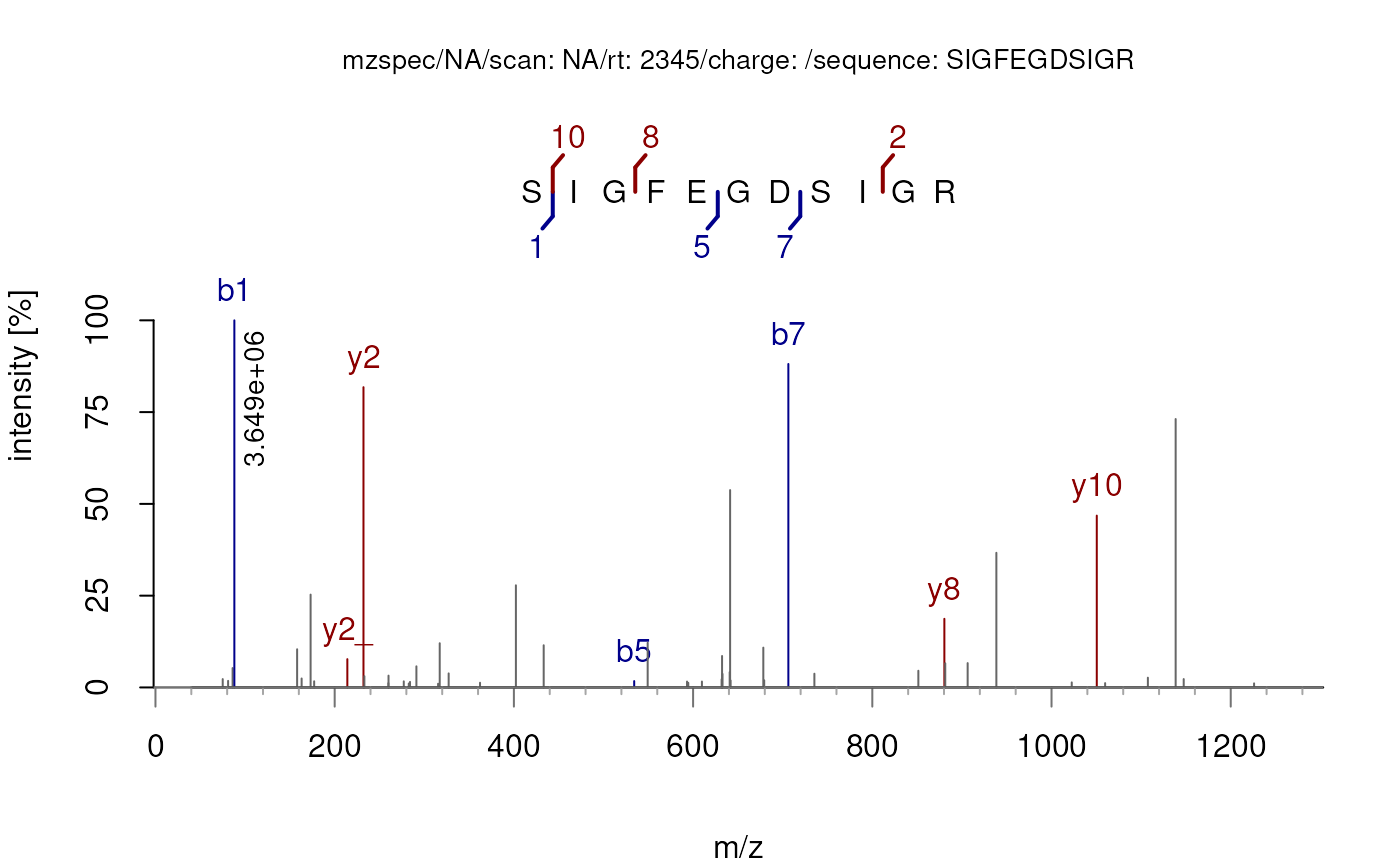
 ## Annotate the spectrum without the delta m/z plot
plotSpectraPTM(sp, deltaMz = FALSE)
## Annotate the spectrum without the delta m/z plot
plotSpectraPTM(sp, deltaMz = FALSE)
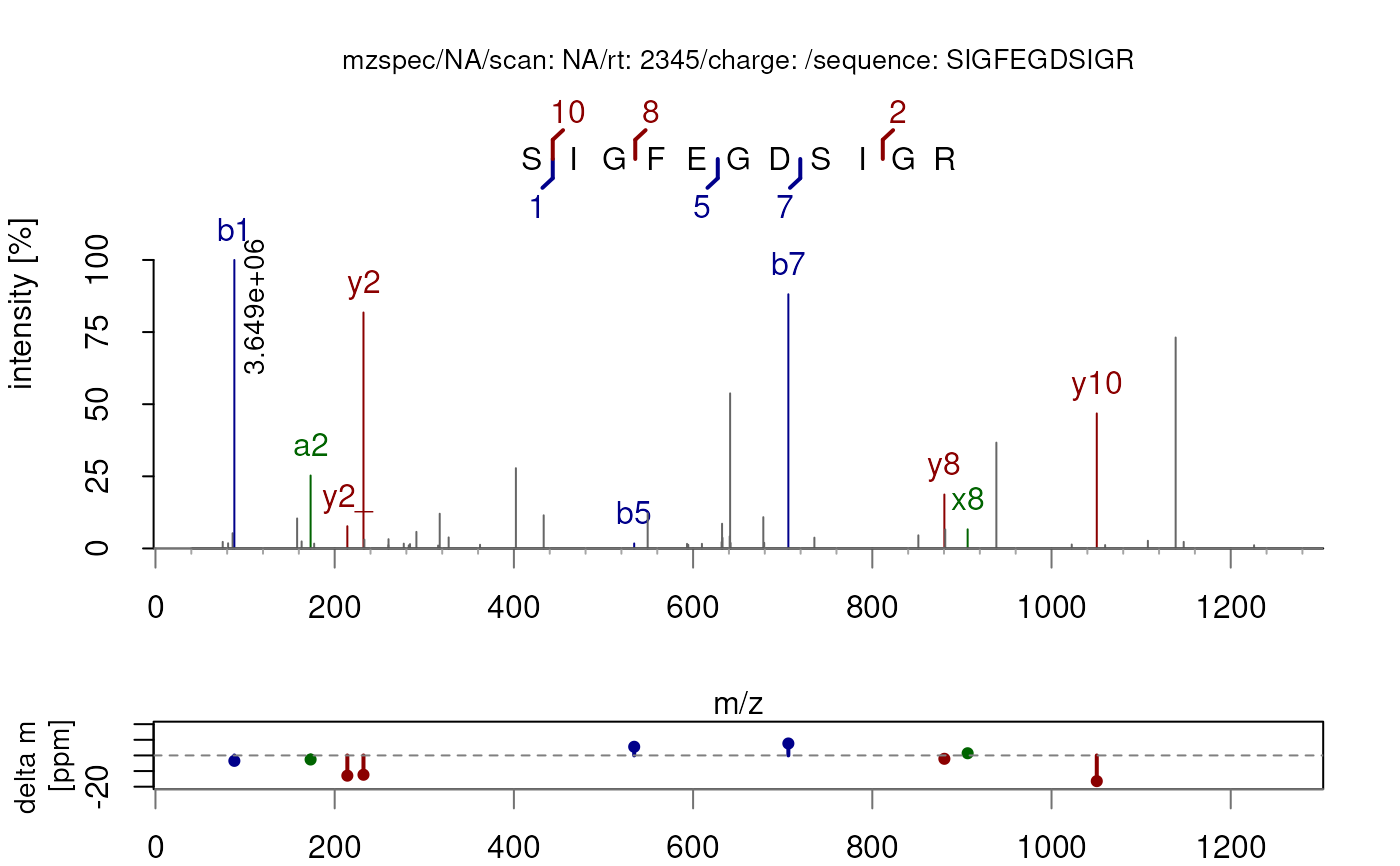
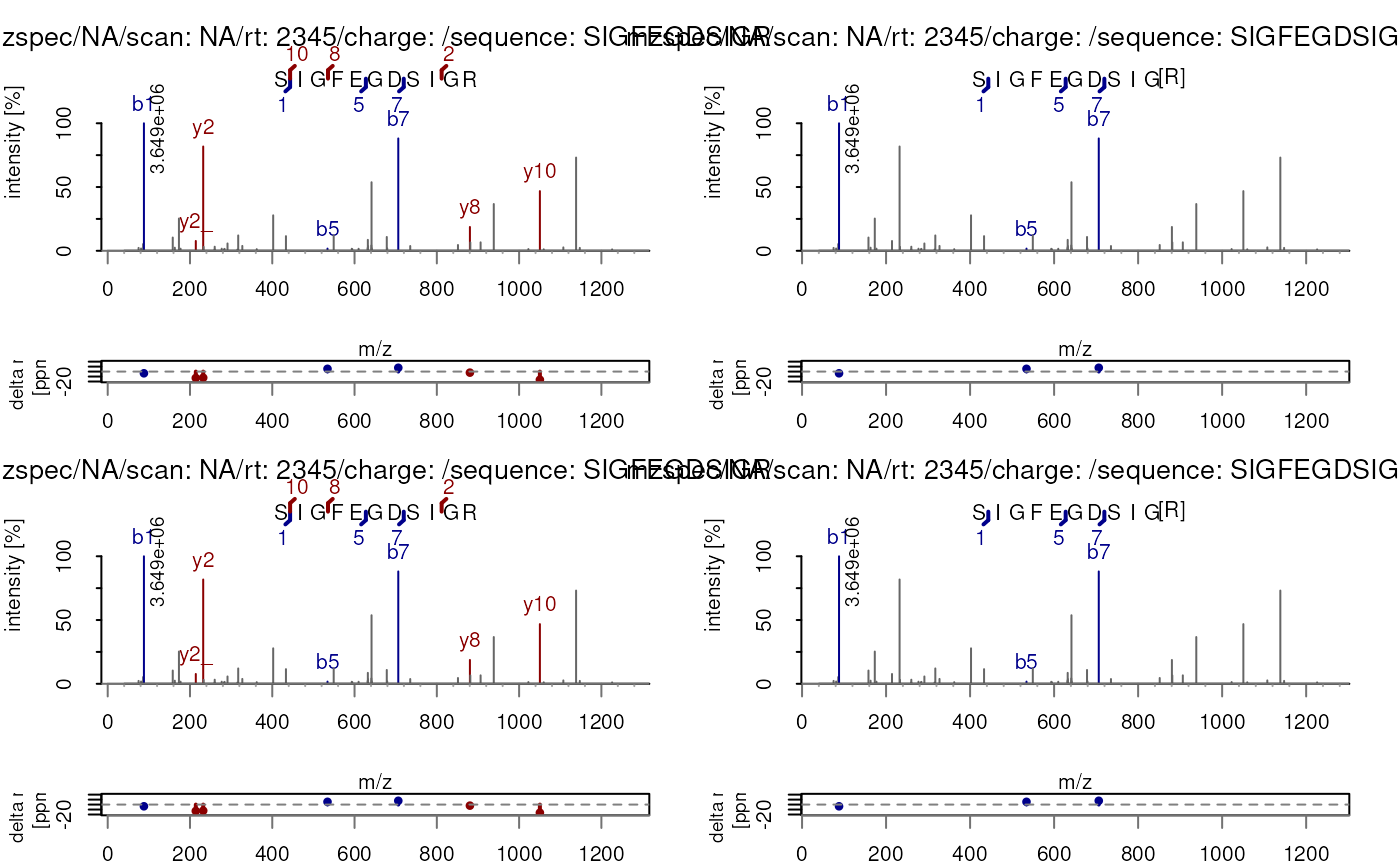
 ## Annotate the spectrum with different ion types
plotSpectraPTM(sp, type = c("a", "b", "x", "y"))
## Annotate the spectrum with different ion types
plotSpectraPTM(sp, type = c("a", "b", "x", "y"))
 ## Annotate the spectrum with modifications using PTMods
sp_mod <- sp
sp_mod$sequence <- PTMods::addFixedModifications("SIGFEGDSIGR", fixedModifications = c(Nterm = "Acetyl"))
plotSpectraPTM(sp_mod)
## Annotate the spectrum with modifications using PTMods
sp_mod <- sp
sp_mod$sequence <- PTMods::addFixedModifications("SIGFEGDSIGR", fixedModifications = c(Nterm = "Acetyl"))
plotSpectraPTM(sp_mod)
 ## Or call them within the function directly:
plotSpectraPTM(sp, fixedModifications = NULL,
variableModifications = c(R = "Methyl"))
#> Warning: Dropping rownames: duplicated rownames present or rownames not available for all data.frames
## Or call them within the function directly:
plotSpectraPTM(sp, fixedModifications = NULL,
variableModifications = c(R = "Methyl"))
#> Warning: Dropping rownames: duplicated rownames present or rownames not available for all data.frames
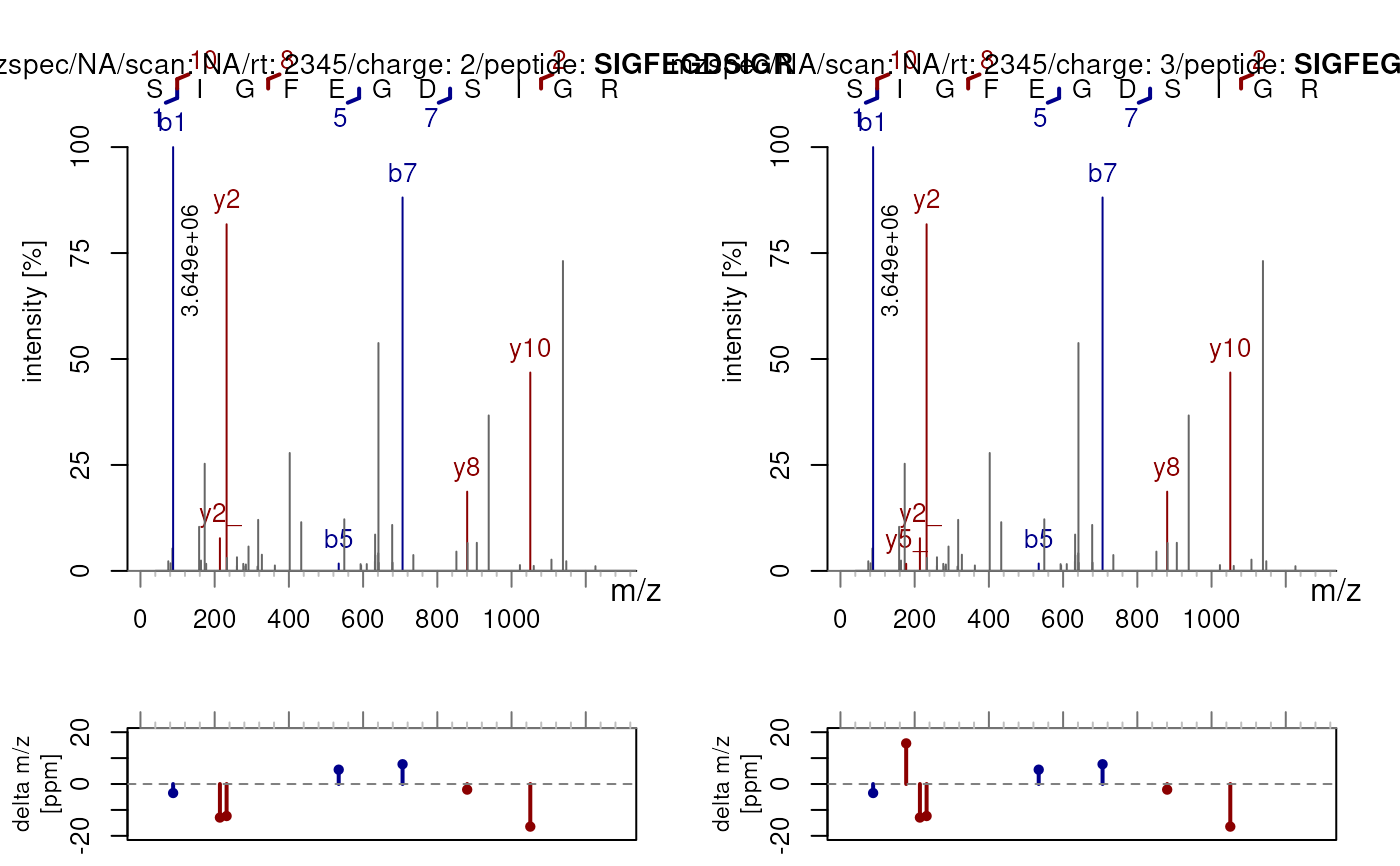
 ## Annotate multiple spectra at a time
plotSpectraPTM(c(sp, sp))
## Annotate multiple spectra at a time
plotSpectraPTM(c(sp, sp))
 ## Color the peaks with different colors
plotSpectraPTM(sp, col = c(y = "red", b = "blue", acxy = "chartreuse3", other = "black"))
## Color the peaks with different colors
plotSpectraPTM(sp, col = c(y = "red", b = "blue", acxy = "chartreuse3", other = "black"))
 ## Use only singly-charged fragments (allCharges = FALSE)
plotSpectraPTM(sp, allCharges = FALSE)
## Use only singly-charged fragments (allCharges = FALSE)
plotSpectraPTM(sp, allCharges = FALSE)
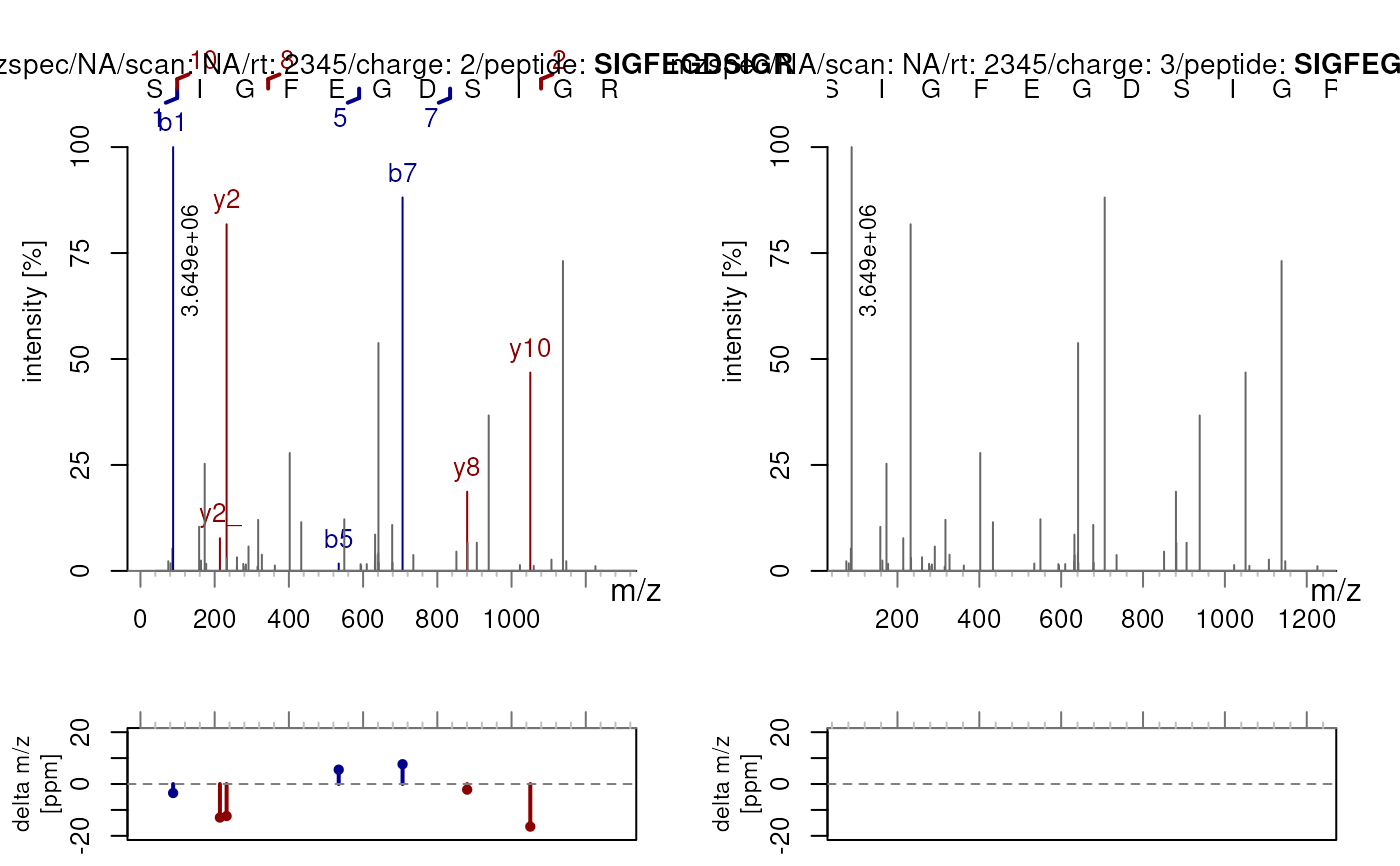
 ## Specify custom charge states for multiple spectra
sp2 <- c(sp, sp)
sp2$precursorCharge <- c(2L, 3L)
plotSpectraPTM(sp2, z = c(2, 3))
## Specify custom charge states for multiple spectra
sp2 <- c(sp, sp)
sp2$precursorCharge <- c(2L, 3L)
plotSpectraPTM(sp2, z = c(2, 3))
 ## Use only the specified charge (no range)
plotSpectraPTM(sp2, z = c(1, 2), allCharges = FALSE)
## Use only the specified charge (no range)
plotSpectraPTM(sp2, z = c(1, 2), allCharges = FALSE)