Spectra() can be plotted with one of the following functions
plotSpectra(): plots each spectrum in its separate plot by splitting the plot area into as many panels as there are spectra.plotSpectraOverlay(): plots all spectra inxinto the same plot (as an overlay).plotSpectraMirror(): plots a pair of spectra as a mirror plot. Parametersxandyboth have to be aSpectraof length 1. Matching peaks (consideringppmandtolerance) are highlighted. SeeMsCoreUtils::common()for details on peak matching. ParametersmatchCol,matchLty,matchLwdandmatchPchallow to customize how matching peaks are indicated.
Usage
plotSpectra(
  x,
  xlab = "m/z",
  ylab = "intensity",
  type = "h",
  xlim = numeric(),
  ylim = numeric(),
  main = character(),
  col = "#00000080",
  labels = list(),
  labelCex = 1,
  labelSrt = 0,
  labelAdj = NULL,
  labelPos = NULL,
  labelOffset = 0.5,
  labelCol = "#00000080",
  asp = 1,
  ...
)

plotSpectraOverlay(
  x,
  xlab = "m/z",
  ylab = "intensity",
  type = "h",
  xlim = numeric(),
  ylim = numeric(),
  main = paste(length(x), "spectra"),
  col = "#00000080",
  labels = list(),
  labelCex = 1,
  labelSrt = 0,
  labelAdj = NULL,
  labelPos = NULL,
  labelOffset = 0.5,
  labelCol = "#00000080",
  axes = TRUE,
  frame.plot = axes,
  ...
)

# S4 method for class 'Spectra'
plotSpectraMirror(
  x,
  y,
  xlab = "m/z",
  ylab = "intensity",
  type = "h",
  xlim = numeric(),
  ylim = numeric(),
  main = character(),
  col = "#00000080",
  labels = list(),
  labelCex = 1,
  labelSrt = 0,
  labelAdj = NULL,
  labelPos = NULL,
  labelOffset = 0.5,
  labelCol = "#00000080",
  axes = TRUE,
  frame.plot = axes,
  ppm = 20,
  tolerance = 0,
  matchCol = "#80B1D3",
  matchLwd = 1,
  matchLty = 1,
  matchPch = 16,
  ...
)
Arguments
- x
a
Spectra()object. ForplotSpectraMirror()it has to be an object of length 2.- xlab
character(1)with the label for the x-axis (by defaultxlab = "m/z").- ylab
character(1)with the label for the y-axis (by defaultylab = "intensity").- type
character(1)specifying the type of plot. Seeplot.default()for details. Defaults totype = "h"which draws each peak as a line.- xlim
numeric(2)defining the x-axis limits. The range of m/z values are used by default.- ylim
numeric(2)defining the y-axis limits. The range of intensity values are used by default.- main
character(1)with the title for the plot. By default the spectrum's MS level and retention time (in seconds) is used.- col
color to be used to draw the peaks. Should be either of length 1, or equal to the number of spectra (to plot each spectrum in a different color) or be a
listwith colors for each individual peak in each spectrum.- labels
allows to specify a label for each peak. Needs to be a
list()with length equal to the number of spectra (each element of the list being acharacter()with length equal to the number of peaks for that spectrum), or, ideally, afunctionthat uses one of theSpectra's variables (see examples below).plotSpectraMirror()supports onlylabelsof type function.- labelCex
numeric(1)giving the amount by which the text should be magnified relative to the default. See parametercexinpar().- labelSrt
numeric(1)defining the rotation of the label. See parametersrtintext().- labelAdj
see parameter
adjintext().- labelPos
see parameter
posintext().- labelOffset
see parameter
offsetintext().- labelCol
color for the label(s).
- asp
for
plotSpectra(): the target ratio (columns / rows) when plotting mutliple spectra (e.g. for 20 spectra useasp = 4/5for 4 columns and 5 rows orasp = 5/4for 5 columns and 4 rows; seegrDevices::n2mfrow()for details).- ...
additional parameters to be passed to the
plot.default()function.- axes
logical(1)whether (x and y) axes should be drawn.- frame.plot
logical(1)whether a box should be drawn around the plotting area.- y
for
plotSpectraMirror():Spectraobject of length 1 against whichxshould be plotted against.- ppm
for
plotSpectraMirror(): m/z relative acceptable difference (in ppm) for peaks to be considered matching (seeMsCoreUtils::common()for more details).- tolerance
for
plotSpectraMirror(): absolute acceptable difference of m/z values for peaks to be considered matching (seeMsCoreUtils::common()for more details).- matchCol
for
plotSpectraMirror(): color for matching peaks.- matchLwd
for
plotSpectraMirror(): line width (lwd) to draw matching peaks. Seepar()for more details.- matchLty
for
plotSpectraMirror(): line type (lty) to draw matching peaks. Seepar()for more details.- matchPch
for
plotSpectraMirror(): point character (pch) to label matching peaks. Defaults tomatchPch = 16, set tomatchPch = NAto disable. Seepar()for more details.
Examples
ints <- list(c(4.3412, 12, 8, 34, 23.4),
c(8, 25, 16, 32))
mzs <- list(c(13.453421, 43.433122, 46.6653553, 129.111212, 322.24432),
c(13.452, 43.5122, 129.112, 322.245))
df <- DataFrame(msLevel = c(1L, 1L), rtime = c(123.12, 124))
df$mz <- mzs
df$intensity <- ints
sp <- Spectra(df)
#### --------------------------------------------- ####
## plotSpectra ##
## Plot one spectrum.
plotSpectra(sp[1])
## Plot both spectra.
plotSpectra(sp)
 ## Define a color for each peak in each spectrum.
plotSpectra(sp, col = list(c(1, 2, 3, 4, 5), 1:4))
## Define a color for each peak in each spectrum.
plotSpectra(sp, col = list(c(1, 2, 3, 4, 5), 1:4))
 ## Color peaks from each spectrum in different colors.
plotSpectra(sp, col = c("green", "blue"))
## Color peaks from each spectrum in different colors.
plotSpectra(sp, col = c("green", "blue"))
 ## Label each peak with its m/z.
plotSpectra(sp, labels = function(z) lapply(mz(z), format, digits = 4))
## Label each peak with its m/z.
plotSpectra(sp, labels = function(z) lapply(mz(z), format, digits = 4))
 ## Rotate the labels.
plotSpectra(sp, labels = function(z) lapply(mz(z), format, digits = 4),
labelPos = 2, labelOffset = 0.1, labelSrt = -30)
## Rotate the labels.
plotSpectra(sp, labels = function(z) lapply(mz(z), format, digits = 4),
labelPos = 2, labelOffset = 0.1, labelSrt = -30)
 ## Add a custom annotation for each peak.
sp$label <- list(c("", "A", "B", "C", "D"),
c("Frodo", "Bilbo", "Peregrin", "Samwise"))
## Plot each peak in a different color
plotSpectra(sp, labels = sp$label,
col = list(1:5, 1:4))
## Add a custom annotation for each peak.
sp$label <- list(c("", "A", "B", "C", "D"),
c("Frodo", "Bilbo", "Peregrin", "Samwise"))
## Plot each peak in a different color
plotSpectra(sp, labels = sp$label,
col = list(1:5, 1:4))
 ## Plot a single spectrum specifying the label.
plotSpectra(sp[2], labels = list(c("A", "B", "C", "D")))
#### --------------------------------------------- ####
## plotSpectraOverlay ##
## Plot both spectra overlaying.
plotSpectraOverlay(sp)
## Plot a single spectrum specifying the label.
plotSpectra(sp[2], labels = list(c("A", "B", "C", "D")))
#### --------------------------------------------- ####
## plotSpectraOverlay ##
## Plot both spectra overlaying.
plotSpectraOverlay(sp)
 ## Use a different color for each spectrum.
plotSpectraOverlay(sp, col = c("#ff000080", "#0000ff80"))
## Label also the peaks with their m/z if their intensity is above 15.
plotSpectraOverlay(sp, col = c("#ff000080", "#0000ff80"),
labels = function(z) {
lapply(seq_along(mz(z)), function(i) {
lbls <- format(mz(z)[[i]], digits = 4)
lbls[intensity(z)[[i]] <= 15] <- ""
lbls
})
})
abline(h = 15, lty = 2)
## Use a different color for each spectrum.
plotSpectraOverlay(sp, col = c("#ff000080", "#0000ff80"))
## Label also the peaks with their m/z if their intensity is above 15.
plotSpectraOverlay(sp, col = c("#ff000080", "#0000ff80"),
labels = function(z) {
lapply(seq_along(mz(z)), function(i) {
lbls <- format(mz(z)[[i]], digits = 4)
lbls[intensity(z)[[i]] <= 15] <- ""
lbls
})
})
abline(h = 15, lty = 2)
 ## Use different asp values
plotSpectra(sp, asp = 1/2)
## Use different asp values
plotSpectra(sp, asp = 1/2)
 plotSpectra(sp, asp = 2/1)
#### --------------------------------------------- ####
## plotSpectraMirror ##
## Plot two spectra against each other.
plotSpectraMirror(sp[1], sp[2])
## Label the peaks with their m/z
plotSpectraMirror(sp[1], sp[2],
labels = function(z) list(format(mz(z)[[1L]], digits = 3)),
labelSrt = -30, labelPos = 2, labelOffset = 0.2)
grid()
plotSpectra(sp, asp = 2/1)
#### --------------------------------------------- ####
## plotSpectraMirror ##
## Plot two spectra against each other.
plotSpectraMirror(sp[1], sp[2])
## Label the peaks with their m/z
plotSpectraMirror(sp[1], sp[2],
labels = function(z) list(format(mz(z)[[1L]], digits = 3)),
labelSrt = -30, labelPos = 2, labelOffset = 0.2)
grid()
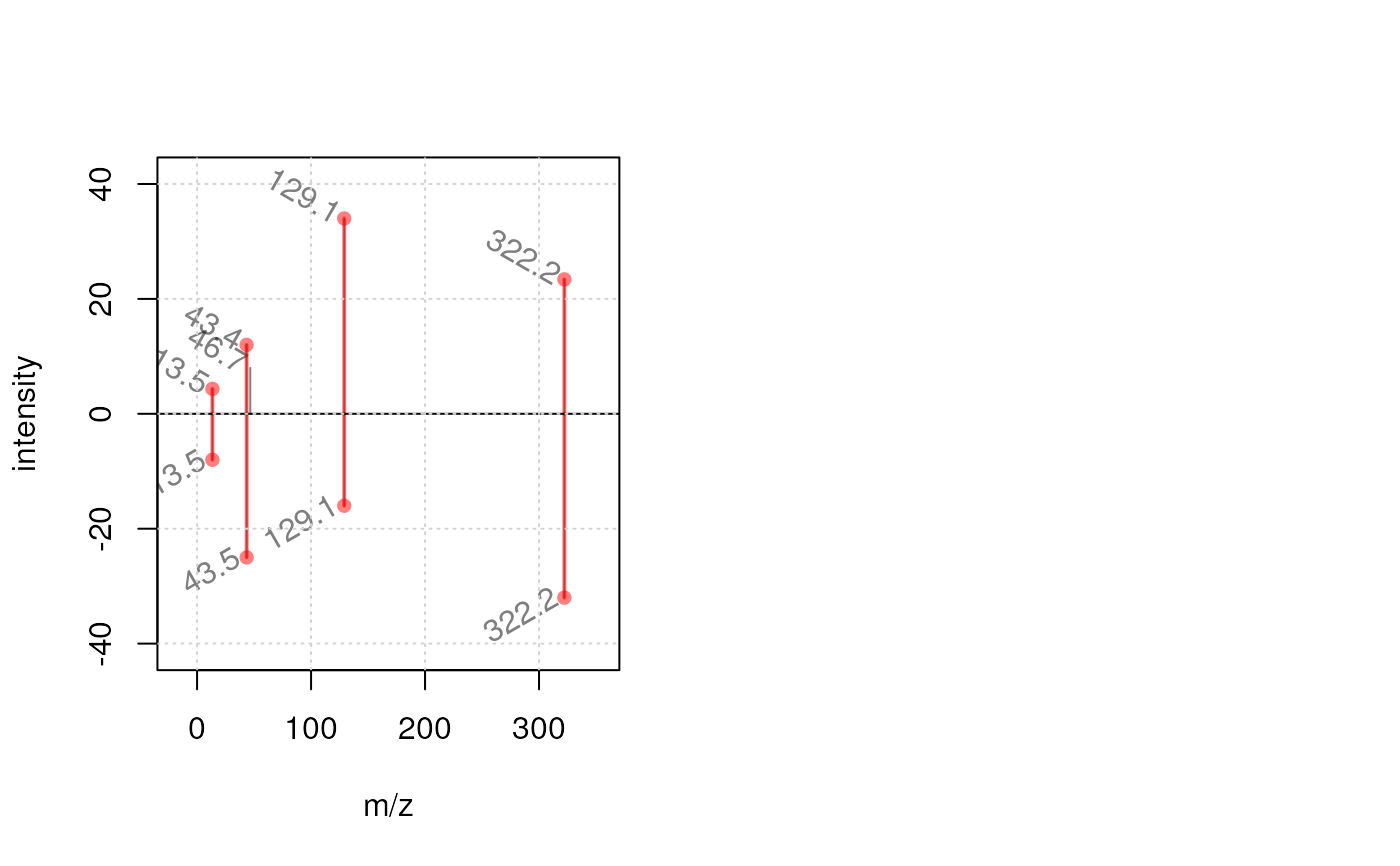
 ## The same plot with a tolerance of 0.1 and using a different color to
## highlight matching peaks
plotSpectraMirror(sp[1], sp[2],
labels = function(z) list(format(mz(z)[[1L]], digits = 3)),
labelSrt = -30, labelPos = 2, labelOffset = 0.2, tolerance = 0.1,
matchCol = "#ff000080", matchLwd = 2)
grid()
## The same plot with a tolerance of 0.1 and using a different color to
## highlight matching peaks
plotSpectraMirror(sp[1], sp[2],
labels = function(z) list(format(mz(z)[[1L]], digits = 3)),
labelSrt = -30, labelPos = 2, labelOffset = 0.2, tolerance = 0.1,
matchCol = "#ff000080", matchLwd = 2)
grid()