1.1 Metabolomics data processing and analysis
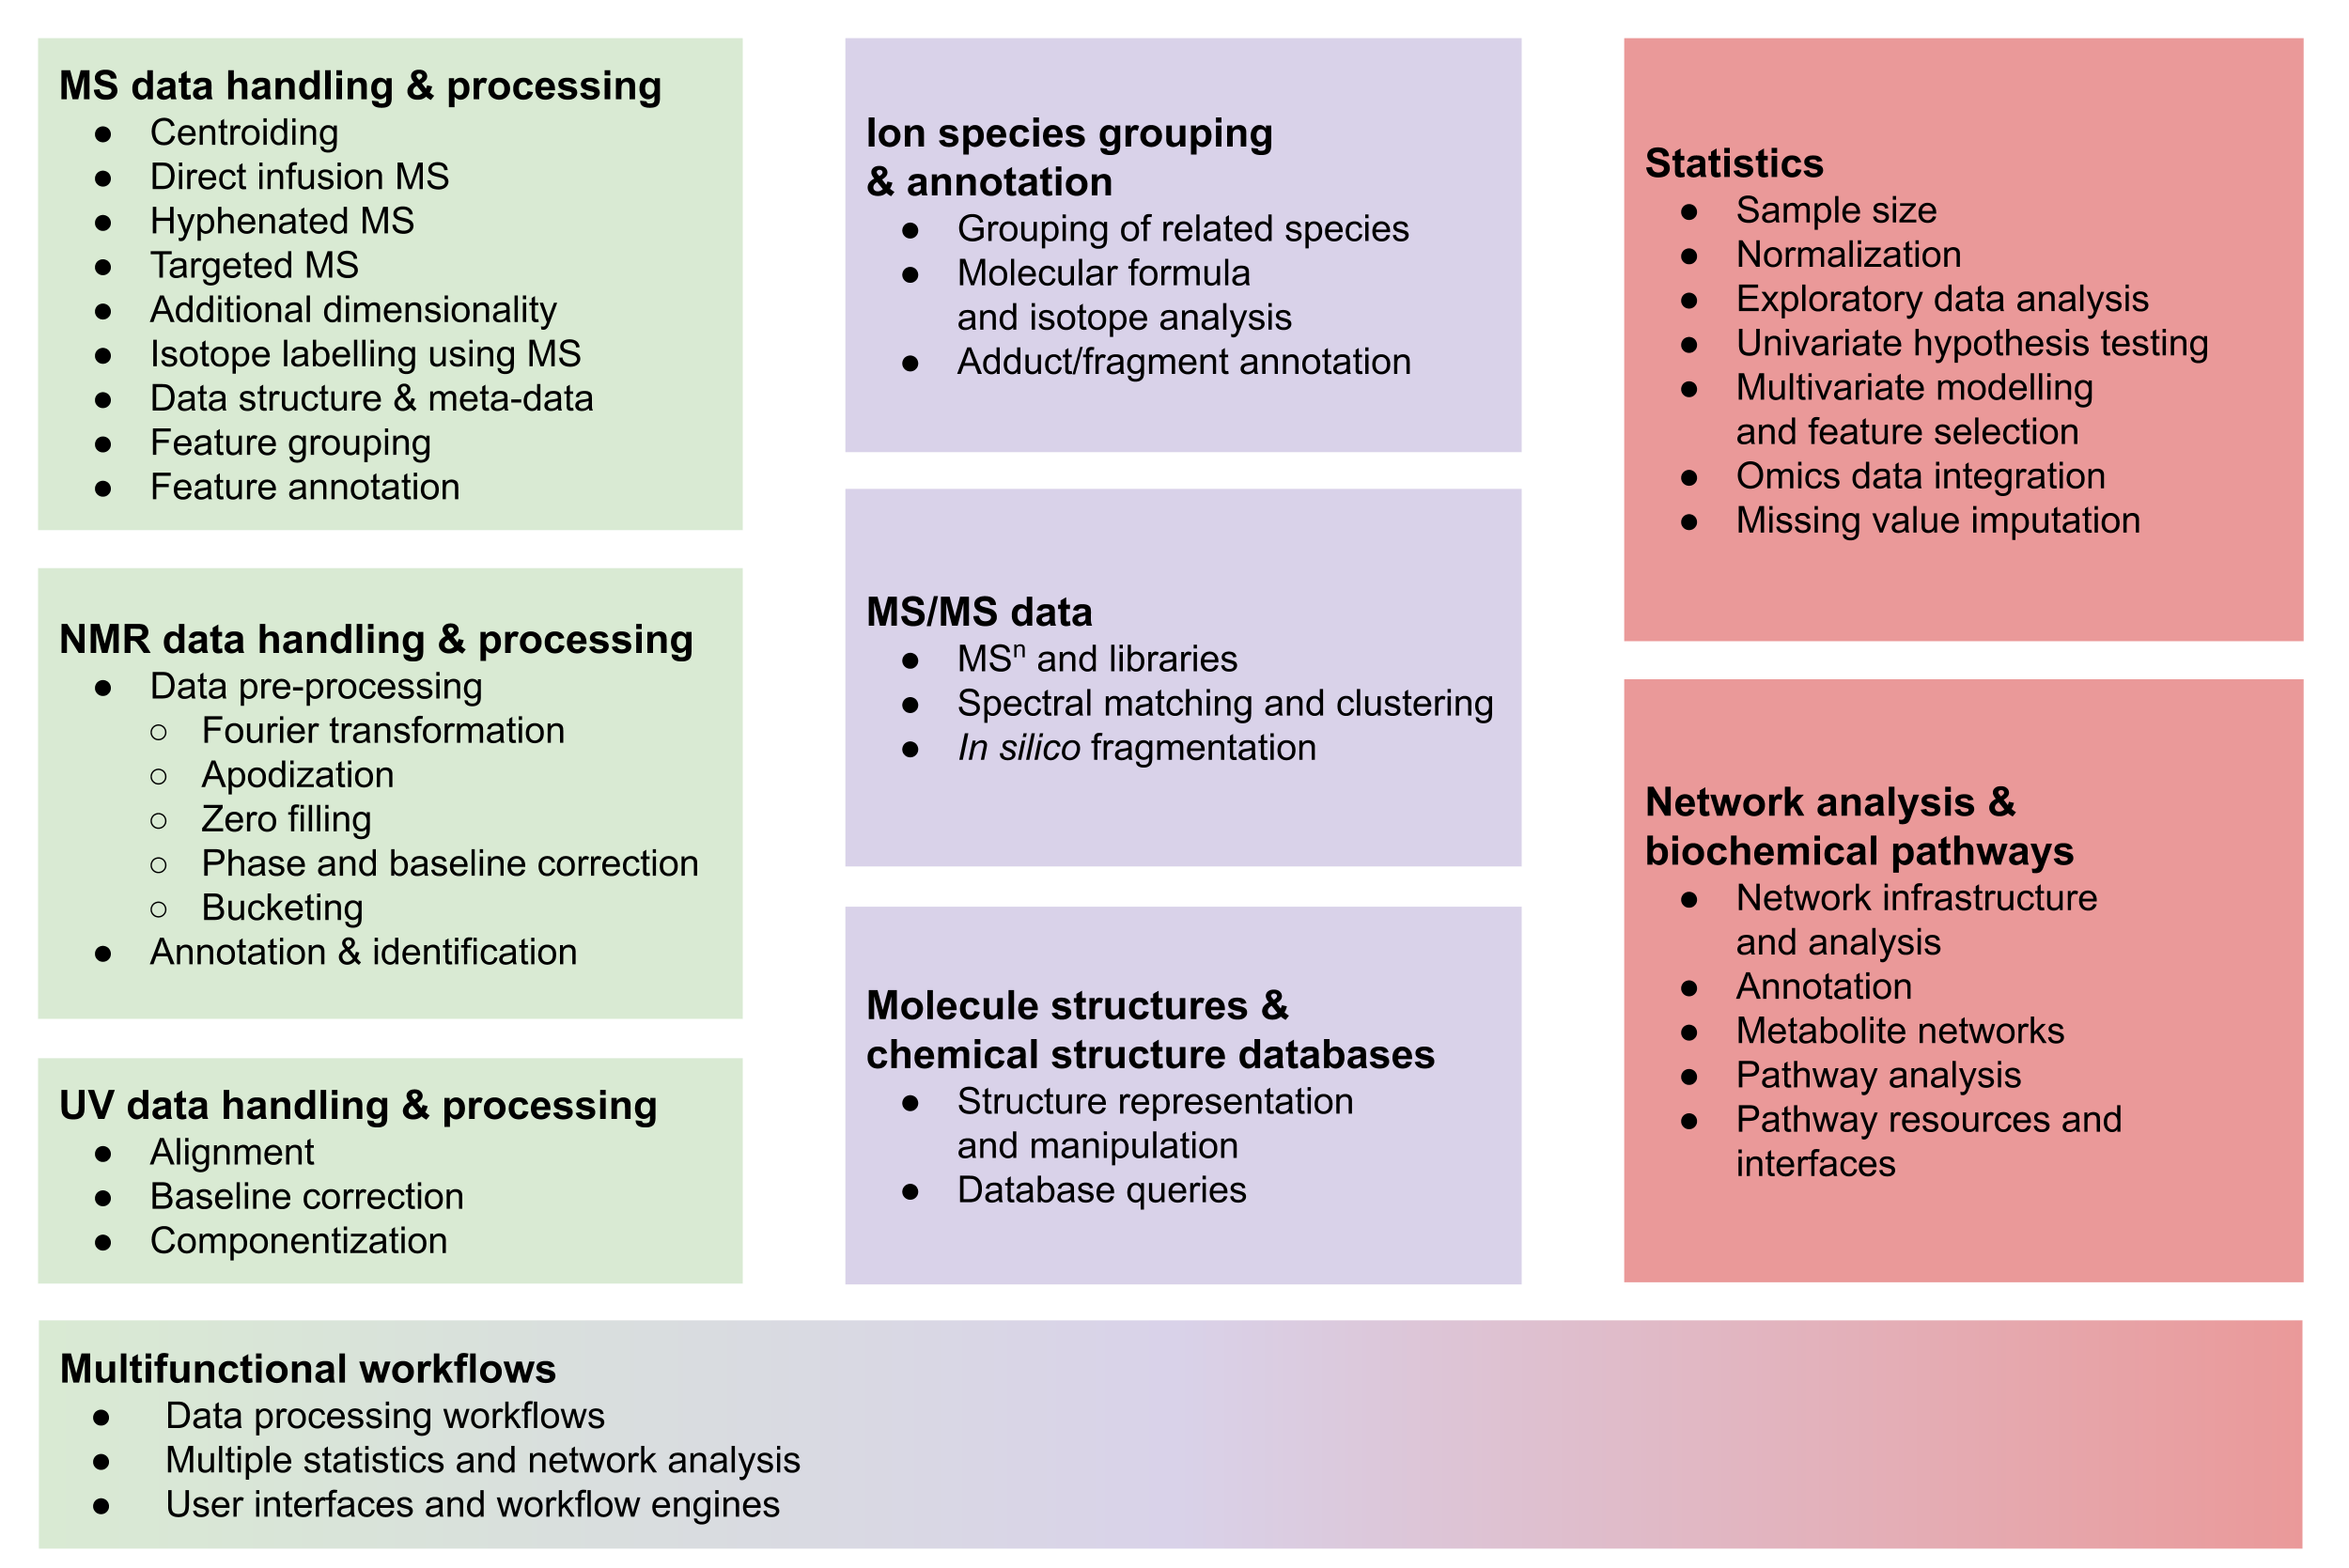 Figure 1: Overview of typical tasks in metabolomics workflows, ranging from metabolite profiling (left, green) via metabolite annotation (center, purple) to data analysis using statistics and metabolite networks (right, red).
The remainder of this section gives a broad overview and explains the typical steps, which are summarized in Figure 1, while common approaches and the available R packages are described in more detail in Section 2.
The first step for any metabolomics study is conversion from vendor formats into open data formats and pre-processing of the obtained raw data. The latter entails converting chromatographic (usually hyphenated to MS) or spectroscopic data into a data matrix suitable for data analysis. For LC-MS data this typically involves feature detection (or peak-picking) in individual samples followed by matching of features between samples. For spectroscopic data, this typically means alignment of spectra and potentially binning of the spectra into ‘buckets’. The final matrix will have samples in one dimension and so-called features (unique chromatographic features or spectral bins) in the other dimension. In NMR based metabolomics, several steps are carried out to process raw time domain data to a spectrum to improve quality such as phasing and baseline correction of the spectrum. Next is alignment of peaks across spectra and samples, followed by segmenting data into bins or a peak fitting step depending on the method used.
Once the analytical data has been preprocessed, it is generally subjected to different statistical approaches to find features that are “interesting” in the context of the experimental design, e.g. differentiating diseased patients from healthy controls. In untargeted metabolomics, the selected features contain only the characteristics (e.g. m/z, retention time, chemical shift, intensity) obtained from the measurement, but not (yet) the metabolite identification or chemical structure as such. Different approaches exist for this metabolite annotation step, ranging from (usually insufficient) database lookup of exact mass (MS) or chemical shift (NMR) alone, to the use of fragmentation patterns obtained in tandem MS experiments, which can be searched against spectral databases or analysed with in silico algorithms, to spectral searching or de novo structure elucidation using combinations of NMR experiments (often 1D and 2D).
Large parts of the metabolomics software landscape in general have been covered in reviews, recent ones include the large list of software packages [8] first described by Spicer et al. [9], and a series of annual reviews covering the list maintained by Misra and others [10–13], a review by Kannan et al. [14] and the review focussing on approaches for compound identification of LC-MS/MS data by Blaženović et al. [15]. These reviews did include software regardless of the programming environment or language used for the implementation. In section 2.9 we briefly mention how those can be accessed from within R.
This review will focus on the ecosystem of R packages for metabolomics. It provides an overview of packages to carry out one or multiple of the above mentioned steps. Some aspects are not covered in depth or not at all. For example, MS based imaging in metabolomics is an area that has unique challenges and merits its own review, and it is also beyond the scope of this review to discuss all statistical methods that could be applied in metabolomics.