Chapter 7 Annex
7.1 Raw MS data under the hood: the mzR package
The mzR package is a direct interface to the
proteowizard code base. It
includes a substantial proportion of pwiz’s C/C++ code for fast and
efficient parsing of these large raw data files.
Let’s start by getting some raw data from the MsDataHub package.
## see ?MsDataHub and browseVignettes('MsDataHub') for documentation## loading from cacheThe three main functions of mzR are
-
openMSfileto create a file handle to a raw data file -
headerto extract metadata about the spectra contained in the file -
peaksto extract one or multiple spectra of interest.
Other functions such as instrumentInfo, or runInfo can be used to
gather general information about a run.
## Mass Spectrometry file handle.
## Filename:  31c07efa899c6_7858
## Number of scans: 7534## [1] 7534 32## [1] "seqNum" "acquisitionNum"
## [3] "msLevel" "polarity"
## [5] "peaksCount" "totIonCurrent"
## [7] "retentionTime" "basePeakMZ"
## [9] "basePeakIntensity" "collisionEnergy"
## [11] "electronBeamEnergy" "ionisationEnergy"
## [13] "lowMZ" "highMZ"
## [15] "precursorScanNum" "precursorMZ"
## [17] "precursorCharge" "precursorIntensity"
## [19] "mergedScan" "mergedResultScanNum"
## [21] "mergedResultStartScanNum" "mergedResultEndScanNum"
## [23] "injectionTime" "filterString"
## [25] "spectrumId" "centroided"
## [27] "ionMobilityDriftTime" "isolationWindowTargetMZ"
## [29] "isolationWindowLowerOffset" "isolationWindowUpperOffset"
## [31] "scanWindowLowerLimit" "scanWindowUpperLimit"## mz intensity
## [1,] 399.9976 0
## [2,] 399.9991 0
## [3,] 400.0006 0
## [4,] 400.0021 0
## [5,] 400.2955 0
## [6,] 400.2970 0## List of 5
## $ : num [1:25800, 1:2] 400 400 400 400 400 ...
## ..- attr(*, "dimnames")=List of 2
## .. ..$ : NULL
## .. ..$ : chr [1:2] "mz" "intensity"
## $ : num [1:25934, 1:2] 400 400 400 400 400 ...
## ..- attr(*, "dimnames")=List of 2
## .. ..$ : NULL
## .. ..$ : chr [1:2] "mz" "intensity"
## $ : num [1:26148, 1:2] 400 400 400 400 400 ...
## ..- attr(*, "dimnames")=List of 2
## .. ..$ : NULL
## .. ..$ : chr [1:2] "mz" "intensity"
## $ : num [1:26330, 1:2] 400 400 400 400 400 ...
## ..- attr(*, "dimnames")=List of 2
## .. ..$ : NULL
## .. ..$ : chr [1:2] "mz" "intensity"
## $ : num [1:26463, 1:2] 400 400 400 400 400 ...
## ..- attr(*, "dimnames")=List of 2
## .. ..$ : NULL
## .. ..$ : chr [1:2] "mz" "intensity"► Question
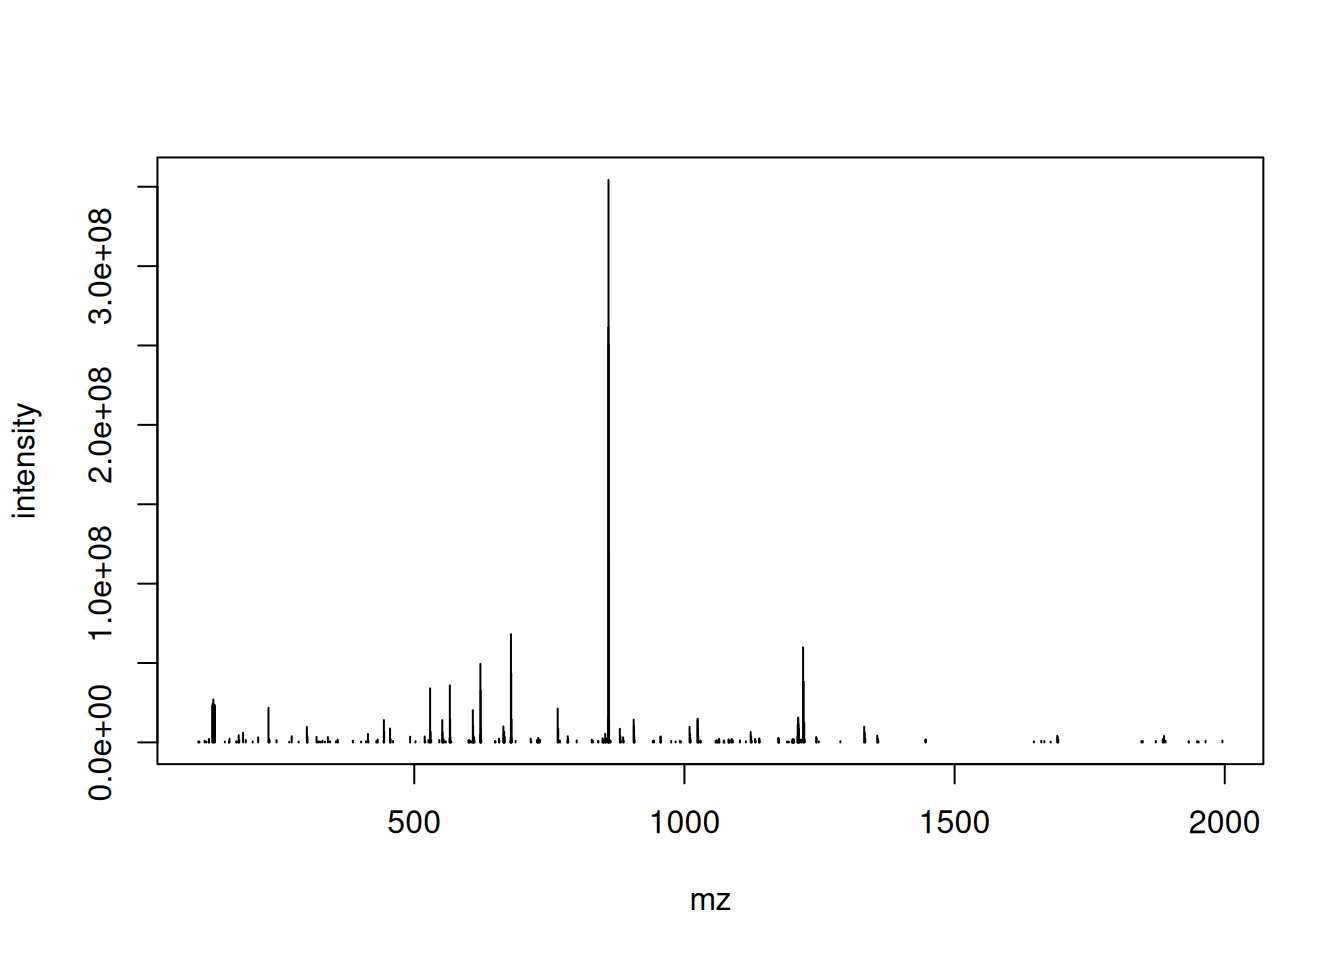
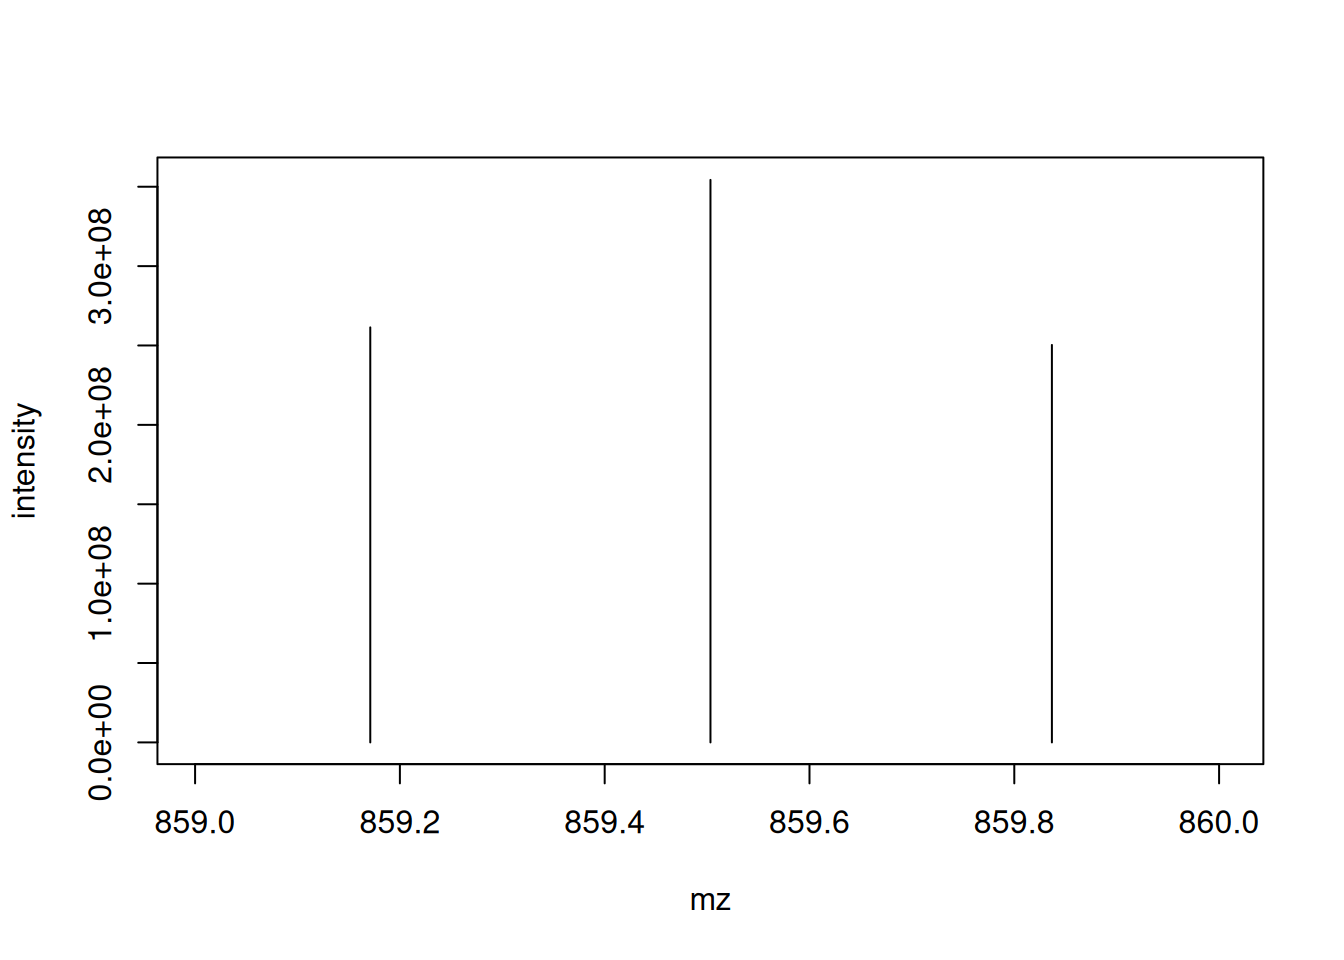
Let’s extract the index of the MS2 spectrum with the highest base peak intensity and plot its spectrum. Is the data centroided or in profile mode?
► Solution
► Question
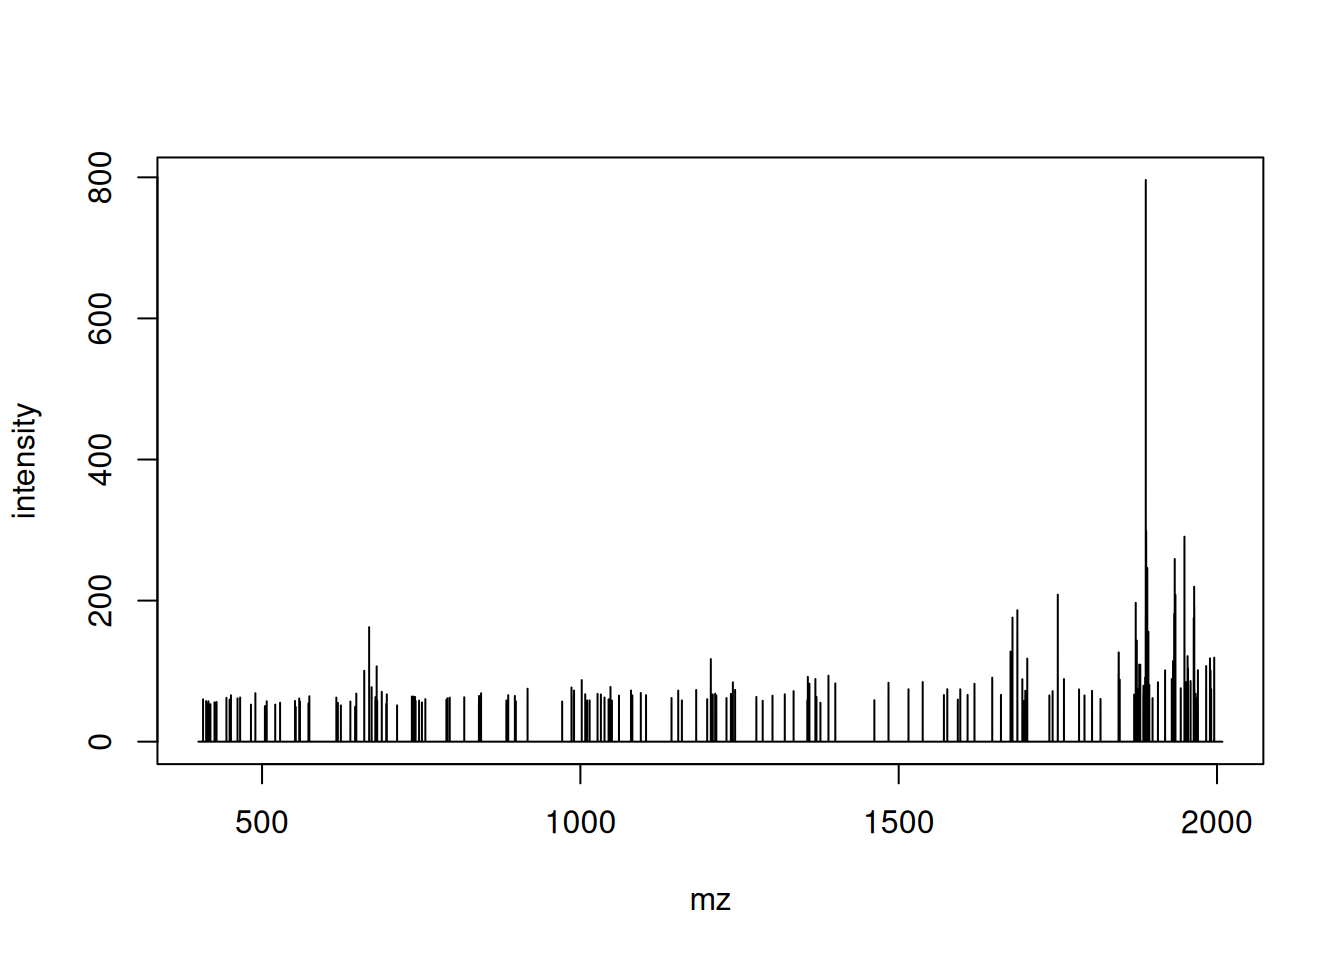
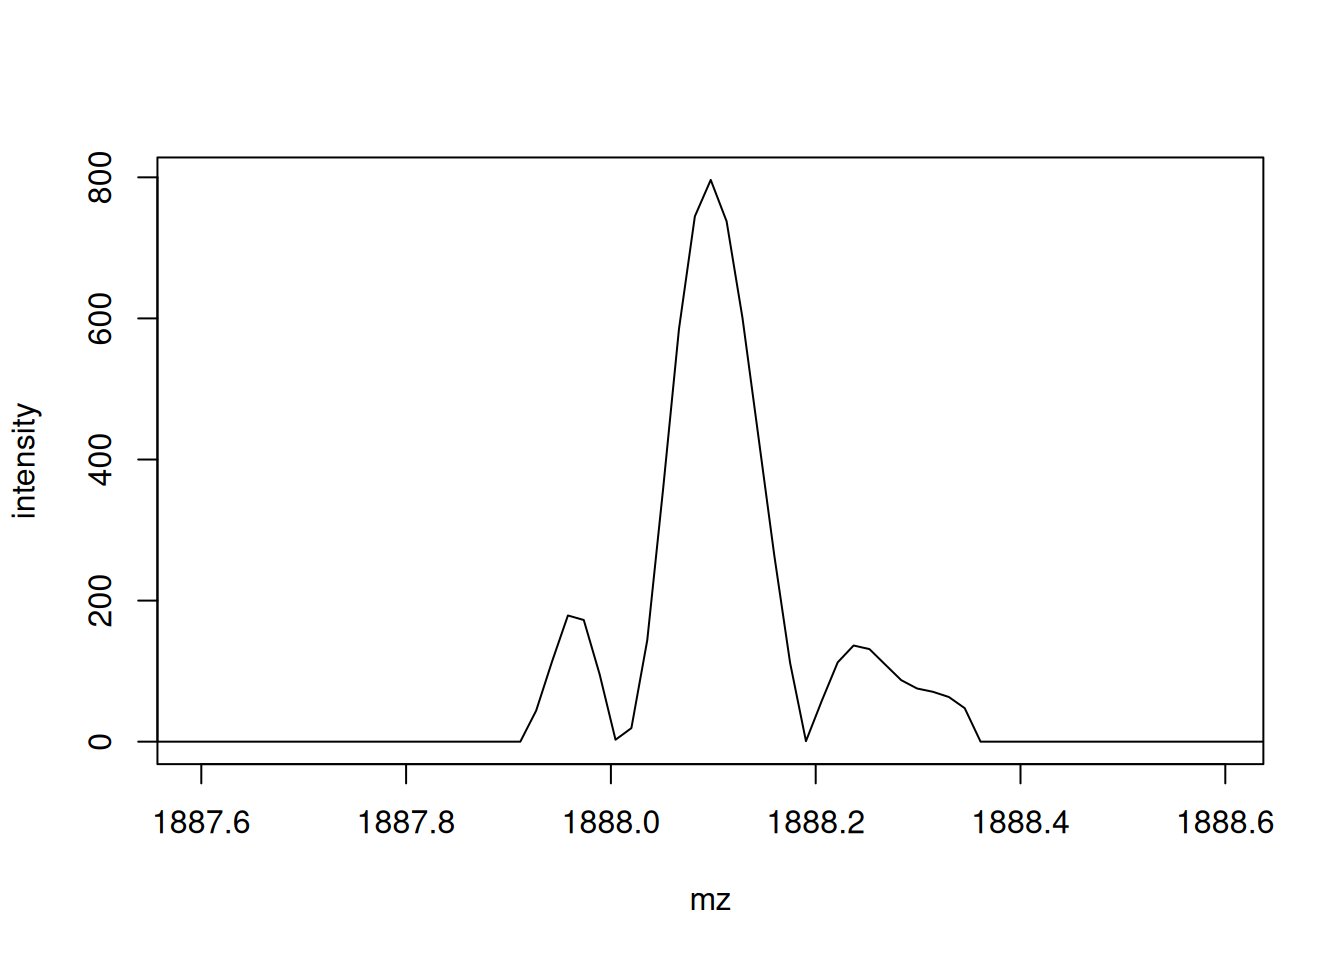
Pick an MS1 spectrum and visually check whether it is centroided or in profile mode.
► Solution
7.2 PSM data under the hood
There are two packages that can be used to parse mzIdentML files,
namely mzR (that we have already used for raw data) and mzID. The
major difference is that the former leverages C++ code from
proteowizard and is hence faster than the latter (which uses the
XML R package). They both work in similar ways.
|Data type      |File format |Data structure |Package |
|:--------------|:-----------|:--------------|:-------|
|Identification |mzIdentML   |mzRident       |mzR     |
|Identification |mzIdentML   |mzID           |mzID    |
Which of these packages is used by PSM() can be defined by the
parser argument, as documented in ?PSM.
mzID
The main functions are mzID to read the data into a dedicated data
class and flatten to transform it into a data.frame.
##                                                    EH7807
## "/home/lgatto/.cache/R/ExperimentHub/31c07e307d0acb_7857"##
## Attaching package: 'mzID'## The following object is masked from 'package:purrr':
##
## flatten## reading 31c07e307d0acb_7857...## DONE!## An mzID object
##
## Software used: MS-GF+ (version: Beta (v10072))
##
## Rawfile: /home/lg390/dev/01_svn/workflows/proteomics/TMT_Erwinia_1uLSike_Top10HCD_isol2_45stepped_60min_01-20141210.mzML
##
## Database: /home/lg390/dev/01_svn/workflows/proteomics/erwinia_carotovora.fasta
##
## Number of scans: 5343
## Number of PSM's: 5656Various data can be extracted from the mzID object, using one of the
accessor functions such as database, software, scans, peptides,
… The object can also be converted into a data.frame using the
flatten function.
##                                      spectrumid scan number(s) acquisitionnum
## 1 controllerType=0 controllerNumber=1 scan=5782           5782           5782
## 2 controllerType=0 controllerNumber=1 scan=6037           6037           6037
## 3 controllerType=0 controllerNumber=1 scan=5235           5235           5235
##   passthreshold rank calculatedmasstocharge experimentalmasstocharge
## 1          TRUE    1               1080.232                 1080.233
## 2          TRUE    1               1002.212                 1002.209
## 3          TRUE    1               1189.280                 1189.284
##   chargestate ms-gf:denovoscore ms-gf:evalue ms-gf:pepqvalue ms-gf:qvalue
## 1           3               174 1.086033e-20               0            0
## 2           3               245 1.988774e-19               0            0
## 3           3               264 5.129649e-19               0            0
##   ms-gf:rawscore ms-gf:specevalue assumeddissociationmethod isotopeerror
## 1            147     3.764831e-27                       HCD            0
## 2            214     6.902626e-26                       HCD            0
## 3            211     1.778789e-25                       HCD            0
##   isdecoy post pre end start accession length
## 1   FALSE    S   R  84    50   ECA1932    155
## 2   FALSE    R   K 315   288   ECA1147    434
## 3   FALSE    A   R 224   192   ECA0013    295
##                          description                              pepseq
## 1         outer membrane lipoprotein PVQIQAGEDSNVIGALGGAVLGGFLGNTIGGGSGR
## 2                     trigger factor        TQVLDGLINANDIEVPVALIDGEIDVLR
## 3 ribose-binding periplasmic protein   TKGLNVMQNLLTAHPDVQAVFAQNDEMALGALR
##   modified modification              idFile
## 1    FALSE         <NA> 31c07e307d0acb_7857
## 2    FALSE         <NA> 31c07e307d0acb_7857
## 3    FALSE         <NA> 31c07e307d0acb_7857
##                                                          spectrumFile
## 1 TMT_Erwinia_1uLSike_Top10HCD_isol2_45stepped_60min_01-20141210.mzML
## 2 TMT_Erwinia_1uLSike_Top10HCD_isol2_45stepped_60min_01-20141210.mzML
## 3 TMT_Erwinia_1uLSike_Top10HCD_isol2_45stepped_60min_01-20141210.mzML
##               databaseFile
## 1 erwinia_carotovora.fasta
## 2 erwinia_carotovora.fasta
## 3 erwinia_carotovora.fasta
##  [ reached 'max' / getOption("max.print") -- omitted 3 rows ]
mzR
The mzR interface provides a similar interface. It is however much
faster as it does not read all the data into memory and only extracts
relevant data on demand. It has also accessor functions such as
softwareInfo, mzidInfo, … (use showMethods(classes = "mzRident", where = "package:mzR"))
to see all available methods.
## Identification file handle.
## Filename:  31c07e307d0acb_7857
## Number of psms: 5759## [1] "MS-GF+ Beta (v10072) "
## [2] "ProteoWizard MzIdentML 3.0.21263 ProteoWizard"The identification data can be accessed as a data.frame with the
psms accessor.
##                                      spectrumID chargeState rank passThreshold
## 1 controllerType=0 controllerNumber=1 scan=5782           3    1          TRUE
## 2 controllerType=0 controllerNumber=1 scan=6037           3    1          TRUE
## 3 controllerType=0 controllerNumber=1 scan=5235           3    1          TRUE
## 4 controllerType=0 controllerNumber=1 scan=5397           3    1          TRUE
## 5 controllerType=0 controllerNumber=1 scan=6075           3    1          TRUE
##   experimentalMassToCharge calculatedMassToCharge
## 1                1080.2325              1080.2321
## 2                1002.2089              1002.2115
## 3                1189.2836              1189.2800
## 4                 960.5365               960.5365
## 5                1264.3409              1264.3419
##                              sequence peptideRef modNum isDecoy post pre start
## 1 PVQIQAGEDSNVIGALGGAVLGGFLGNTIGGGSGR       Pep1      0   FALSE    S   R    50
## 2        TQVLDGLINANDIEVPVALIDGEIDVLR       Pep2      0   FALSE    R   K   288
## 3   TKGLNVMQNLLTAHPDVQAVFAQNDEMALGALR       Pep3      0   FALSE    A   R   192
## 4         SQILQQAGTSVLSQANQVPQTVLSLLR       Pep4      0   FALSE    -   R   264
## 5 PIIGDNPFVVVLPDVVLDESTADQTQENLALLISR       Pep5      0   FALSE    F   R   119
##   end DatabaseAccess DBseqLength DatabaseSeq
## 1  84        ECA1932         155
## 2 315        ECA1147         434
## 3 224        ECA0013         295
## 4 290        ECA1731         290
## 5 153        ECA1443         298
##                                    DatabaseDescription scan.number.s.
## 1                   ECA1932 outer membrane lipoprotein           5782
## 2                               ECA1147 trigger factor           6037
## 3           ECA0013 ribose-binding periplasmic protein           5235
## 4                                    ECA1731 flagellin           5397
## 5 ECA1443 UTP--glucose-1-phosphate uridylyltransferase           6075
##   acquisitionNum
## 1           5782
## 2           6037
## 3           5235
## 4           5397
## 5           6075
## [ reached 'max' / getOption("max.print") -- omitted 1 rows ]Page built: 2026-06-26 using R version 4.6.0 (2026-04-24)