Chapter 2 Introduction
2.1 How does mass spectrometry work?
Mass spectrometry (MS) is a technology that separates charged molecules (ions) based on their mass to charge ratio (M/Z). It is often coupled to chromatography (liquid LC, but can also be gas-based GC). The time an analyte takes to elute from the chromatography column is the retention time.
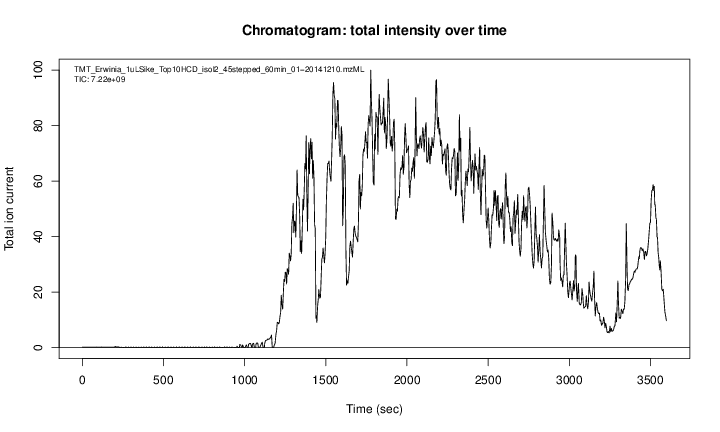
Figure 2.1: A chromatogram, illustrating the total amount of analytes over the retention time.
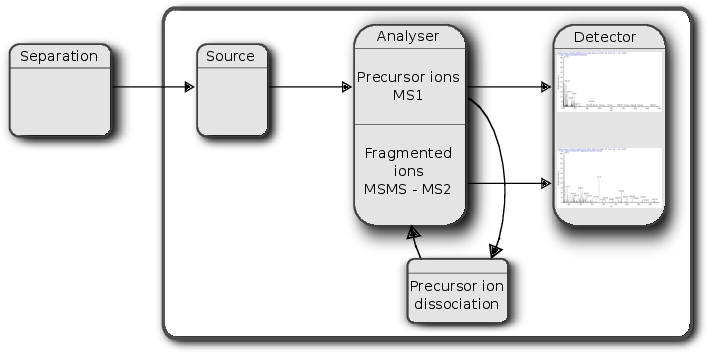
An mass spectrometer is composed of three components:
- The source, that ionises the molecules: examples are Matrix-assisted laser desorption/ionisation (MALDI) or electrospray ionisation. (ESI)
- The analyser, that separates the ions: Time of flight (TOF) or Orbitrap.
- The detector that quantifies the ions.
When using mass spectrometry for proteomics, the proteins are first digested with a protease such as trypsin. In mass shotgun proteomics, the analytes assayed in the mass spectrometer are peptides.
Often, ions are subjected to more than a single MS round. After a first round of separation, the peaks in the spectra, called MS1 spectra, represent peptides. At this stage, the only information we possess about these peptides are their retention time and their mass-to-charge (we can also infer their charge by inspecting their isotopic envelope, i.e the peaks of the individual isotopes, see below), which is not enough to infer their identify (i.e. their sequence).
In MSMS (or MS2), the settings of the mass spectrometer are set automatically to select a certain number of MS1 peaks (for example 20)1 Here, we will focus on data dependent acquisition (DDA), where MS1 peaks are selected. In data independent acquisition (DIA), all peaks in the MS1 spectrum are fragmented.. Once a narrow M/Z range has been selected (corresponding to one high-intensity peak, a peptide, and some background noise), it is fragmented (using for example collision-induced dissociation (CID), higher energy collisional dissociation (HCD) or electron-transfer dissociation (ETD)). The fragment ions are then themselves separated in the analyser to produce a MS2 spectrum. The unique fragment ion pattern can then be used to infer the peptide sequence using de novo sequencing (when the spectrum is of high enough quality) or using a search engine such as, for example Mascot, MSGF+, …, that will match the observed, experimental spectrum to theoretical spectra (see details below).
Figure 2.2: Schematics of a mass spectrometer and two rounds of MS.
The animation below show how 25 ions different ions (i.e. having different M/Z values) are separated throughout the MS analysis and are eventually detected (i.e. quantified). The final frame shows the hypothetical spectrum.
Figure 2.3: Separation and detection of ions in a mass spectrometer.
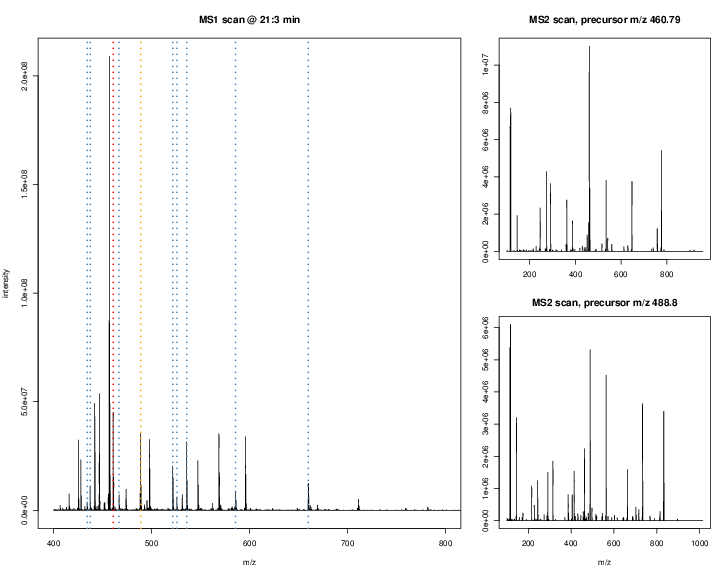
The figures below illustrate the two rounds of MS. The spectrum on the left is an MS1 spectrum acquired after 21 minutes and 3 seconds of elution. 10 peaks, highlited by dotted vertical lines, were selected for MS2 analysis. The peak at M/Z 460.79 (488.8) is highlighted by a red (orange) vertical line on the MS1 spectrum and the fragment spectra are shown on the MS2 spectrum on the top (bottom) right figure.
Figure 2.4: Parent ions in the MS1 spectrum (left) and two sected fragment ions MS2 spectra (right)
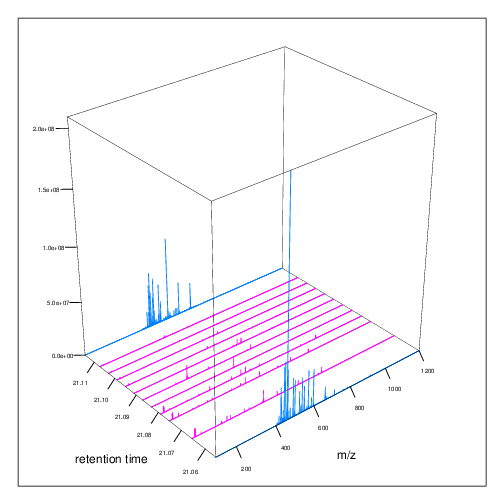
The figures below represent the 3 dimensions of MS data: a set of spectra (M/Z and intensity) of retention time, as well as the interleaved nature of MS1 and MS2 (and there could be more levels) data.
Figure 2.5: MS1 spectra over retention time.
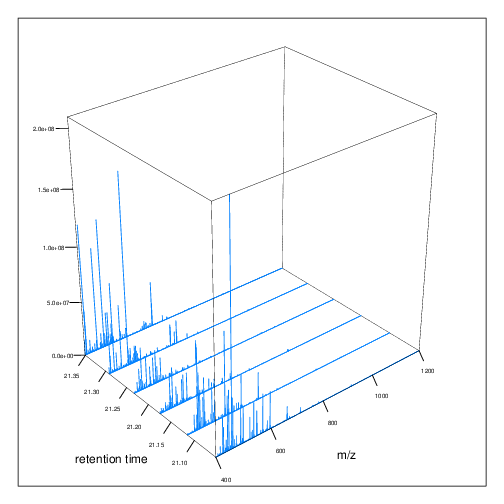
Figure 2.6: MS2 spectra interleaved between two MS1 spectra.
2.2 Accessing data
From the ProteomeXchange database
MS-based proteomics data is disseminated through the ProteomeXchange infrastructure, which centrally coordinates submission, storage and dissemination through multiple data repositories, such as the PRoteomics IDEntifications (PRIDE) database at the EBI for mass spectrometry-based experiments (including quantitative data, as opposed as the name suggests), PASSEL at the ISB for Selected Reaction Monitoring (SRM, i.e. targeted) data and the MassIVE resource. These data can be downloaded within R using the rpx package.
Using the unique PXD000001 identifier, we can retrieve the relevant
metadata that will be stored in a PXDataset object. The names of the
files available in this data can be retrieved with the pxfiles
accessor function.
## Loading PXD000001 from cache.## Project PXD000001 with 11 files
## ## Resource ID BFC1 in cache in /home/lgatto/.cache/R/rpx.## [1] 'F063721.dat' ... [11] 'erwinia_carotovora.fasta'
## Use 'pxfiles(.)' to see all files.## Project PXD000001 files (11):
## [remote] F063721.dat
## [local] F063721.dat-mztab.txt
## [remote] PRIDE_Exp_Complete_Ac_22134.xml.gz
## [remote] PRIDE_Exp_mzData_Ac_22134.xml.gz
## [remote] PXD000001_mztab.txt
## [remote] README.txt
## [local] TMT_Erwinia_1uLSike_Top10HCD_isol2_45stepped_60min_01-20141210.mzML
## [remote] TMT_Erwinia_1uLSike_Top10HCD_isol2_45stepped_60min_01-20141210.mzXML
## [remote] TMT_Erwinia_1uLSike_Top10HCD_isol2_45stepped_60min_01.mzXML
## [remote] TMT_Erwinia_1uLSike_Top10HCD_isol2_45stepped_60min_01.raw
## ...Other metadata for the px data set:
## [1] "Erwinia carotovora"## [1] "ftp://ftp.pride.ebi.ac.uk/pride/data/archive/2012/03/PXD000001/generated"## [1] "Gatto L, Christoforou A; Using R and Bioconductor for proteomics data analysis., Biochim Biophys Acta, 2013 May 18, doi:10.1016/j.bbapap.2013.04.032 PMID:NA"Data files can then be downloaded with the pxget function. Below, we
retrieve the raw data file. The file is
downloaded2 If the file is already available, it is not downloaded a second time.
in the working directory and the name of the file is return by the
function and stored in the mzf variable for later use 3 This and other files are also availabel in the MsDataHub package, described below.
## Warning in rep(as.integer(len), length = length(str)): partial argument match
## of 'length' to 'length.out'
## Loading TMT_Erwinia_1uLSike_Top10HCD_isol2_45stepped_60min_01-20141210.mzML from cache.## [1] "/home/lgatto/.cache/R/rpx/c83ad32ce6d20_TMT_Erwinia_1uLSike_Top10HCD_isol2_45stepped_60min_01-20141210.mzML"Data hub
The Bioconductor project had dedicated data hubs for experiment and annotation data. Data that is accessed through these hubs are cached centrally to avoid repeated downloads.
The MsDataHub package provides data for
mass spectrometry in general, and proteomics in particular. Once
loaded, the MsDataHub() function lists the available datasets
##                                                                 Title
## 1                                                            ko15.CDF
## 2                                            cptac_a_b_c_peptides.txt
## 3                                              cptac_a_b_peptides.txt
## 4                                                  cptac_peptides.txt
## 5 TMT_Erwinia_1uLSike_Top10HCD_isol2_45stepped_60min_01.20141210.mzid
##                                                                                                       Description
## 1                                           Raw metabolomics MS file in netCDF format. See ?ko15.CDF for details.
## 2 Conditions A, B and C of the CPTAC quantitative proteomics data (tab-delimited format). See ?cptac for details.
## 3    Conditions A and B of the CPTAC quantitative proteomics data (tab-delimited format). See ?cptac for details.
## 4                              CPTAC quantitative proteomics data (tab-delimited format). See ?cptac for details.
## 5                             Peptide spectrum matches from the PDX000001 experiment. See ?PXD000001 for details.
##   BiocVersion Genome SourceType
## 1        3.17     NA        CDF
## 2        3.17     NA        TXT
## 3        3.17     NA        TXT
## 4        3.17     NA        TXT
## 5        3.17     NA       mzid
##                                                                                                          SourceUrl
## 1                                          https://bioconductor.org/packages/3.16/data/experiment/html/msdata.html
## 2                                         https://uclouvain-cbio.github.io/WSBIM2122/data/cptac_a_b_c_peptides.txt
## 3                                          https://bioconductor.org/packages/3.16/data/experiment/html/msdata.html
## 4 https://raw.githubusercontent.com/statOmics/PDA/data/quantification/fullCptacDatasSetNotForTutorial/peptides.txt
## 5                                          https://bioconductor.org/packages/3.16/data/experiment/html/msdata.html
##   SourceVersion                  Species TaxonomyId Coordinate_1_based
## 1             1             Mus musculus      10090                 NA
## 2             1 Saccharomyces cerevisiae       4932                 NA
## 3             1 Saccharomyces cerevisiae       4932                 NA
## 4             1 Saccharomyces cerevisiae       4932                 NA
## 5             1       Erwinia carotovora        554                 NA
##   DataProvider                                 Maintainer RDataClass
## 1           NA Laurent Gatto <laurent.gatto@uclouvain.be>    Spectra
## 2           NA Laurent Gatto <laurent.gatto@uclouvain.be> data.frame
## 3           NA Laurent Gatto <laurent.gatto@uclouvain.be> data.frame
## 4           NA Laurent Gatto <laurent.gatto@uclouvain.be> data.frame
## 5           NA Laurent Gatto <laurent.gatto@uclouvain.be>    Spectra
##   DispatchClass Location_Prefix
## 1      FilePath
## 2      FilePath
## 3      FilePath
## 4      FilePath
## 5      FilePath
##                                                                                 RDataPath
## 1                                                                  MsDataHub/cdf/ko15.CDF
## 2                                                MsDataHub/cptac/cptac_a_b_c_peptides.txt
## 3                                                  MsDataHub/cptac/cptac_a_b_peptides.txt
## 4                                                      MsDataHub/cptac/cptac_peptides.txt
## 5 MsDataHub/PXD000001/TMT_Erwinia_1uLSike_Top10HCD_isol2_45stepped_60min_01-20141210.mzid
##   Tags
## 1   NA
## 2   NA
## 3   NA
## 4   NA
## 5   NA
##  [ reached 'max' / getOption("max.print") -- omitted 52 rows ]
The dataset table is also available as an interactive table on the package page.
Each data can then be downloaded with a dedicated function, for example
## see ?MsDataHub and browseVignettes('MsDataHub') for documentation## loading from cache## EH7803
## "/home/lgatto/.cache/R/ExperimentHub/31c07e7ad7494a_7853"Note that the (compressed)
TMT_Erwinia_1uLSike_Top10HCD_isol2_45stepped_60min_01-20141210.mzML
file downloaded above happens to also be available in MsDataHub.
## see ?MsDataHub and browseVignettes('MsDataHub') for documentation## loading from cache## EH7808
## "/home/lgatto/.cache/R/ExperimentHub/31c07efa899c6_7858"In addition to raw data, there’s also the matchin identification data
##                                                    EH7807
## "/home/lgatto/.cache/R/ExperimentHub/31c07e307d0acb_7857"
and a quantitative proteomics data table
##                                                    EH7805
## "/home/lgatto/.cache/R/ExperimentHub/31c07e3004a564_7855"
Often, experiment packages distribute processed data; examples thereof are the pRolocdata and scpdata packages, that ship processed and annotated quantitative spatial and single-cell proteomics data.
Page built: 2026-06-26 using R version 4.6.0 (2026-04-24)